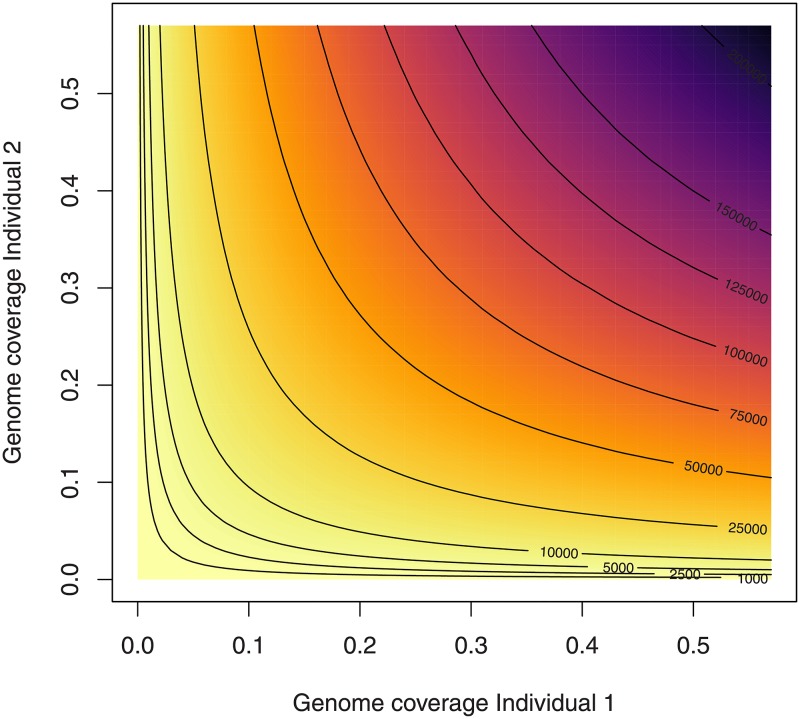
Fig 4. Number of SNP sites covered in both individuals dependent on the sequencing coverage for each individual.
This figure shows expected number of SNP sites with overlapping data for two individuals for different combinations of sequencing depths. The contour lines mark different numbers of SNPs including those used in the simulations (see Fig 2). The total number of SNPs is set to 1,156,468, identical to what has been used in the simulations and similar to the 1.2 million SNPs used in the empirical data set [35]. The calculation assumes a Poisson distribution of sequencing coverage across the genome [49] and that coverage at each SNP site and individual is independent.

