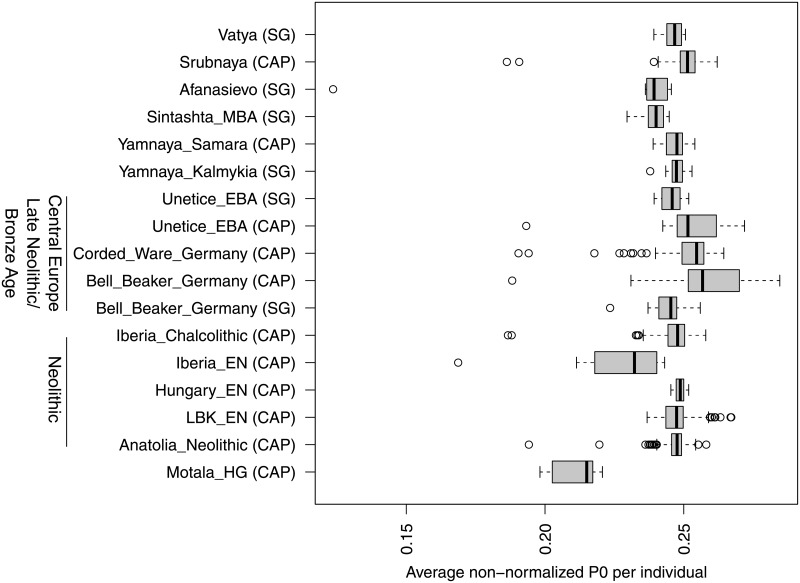
Fig 7. Population distributions of average P0 before normalization.
The boxplots show all non-normalized average P0 scores (one per pair of individuals) per culture. CAP and SG indicate whether the individuals were subject to SNP capture or shotgun sequencing, respectively. A broader chronological/geographical context is shown on the left.

