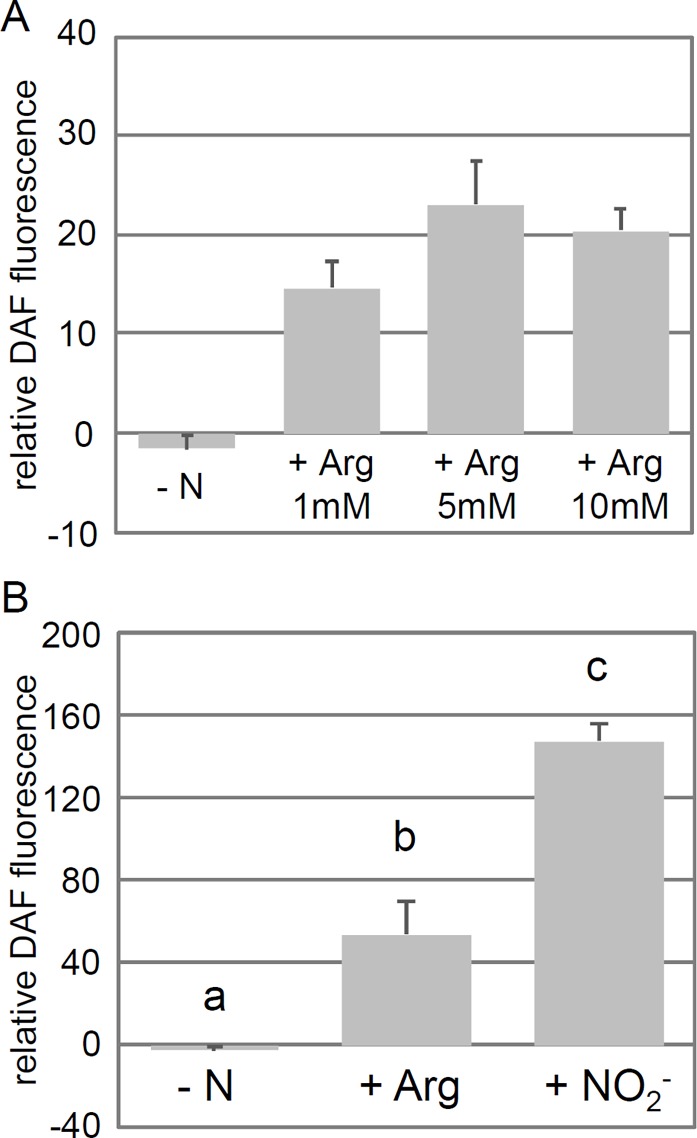
Fig 4. Application of arginine leads to an increase in DAF-FM DA fluorescence.
Cells of the 704 strain were left to grow for several days in medium containing 8 mM NH4+ until they reached the exponential growth phase. Cells were then washed and transferred to nitrogen-free medium where they were exposed for one hour to different nitrogen sources as indicated on the figure. Background fluorescence due to autofluoresence was determined in a control without DAF-FM DA and was subtracted to the total fluorescence measured in the samples. (A). DAF-FM DA fluorescence measured after exposure to different concentrations of arginine. (B). DAF-FM DA fluorescence measured after exposure to 10 mM of Arginine and 10 mM of NO2-. Error bars represent the standard error from at least three independent measurements in (A), and at least seven independent measurements from two experiments in (B). Statistical differences between nitrogen treatments in (B) was determined with a one way ANOVA followed by multiple group comparison with the Tukey test. There was a significant effect of the nitrogen source on DAF-FM DA fluorescence (P<0.001, α = 0.05), and letters indicate the different statistical groups.

