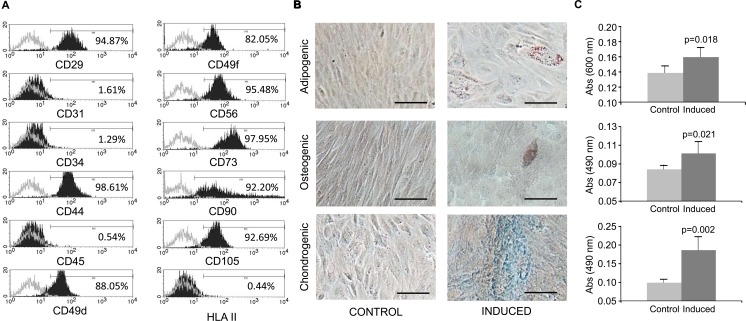
Fig 2. Phenotypical characterization and differentiation potential of endMSCs.
(A) Flow cytometry analysis of endMSCs isolated from menstrual blood. A representative histogram together with the expression levels is shown. The expression of cell surface markers is represented as the percentage of positive cells (black lined histogram) above the negative control (grey lined histogram). (B) In vitro differentiation potential of endMSCs. The cells were in vitro cultured for 21 days with standard medium (Control) or with specific differentiation media for adipogenic, osteogenic and chondrogenic lineages (Induced). Differentiation towards adipocytes, osteocytes and chondrocytes was evidenced by Oil Red O, Alizarin Red and Alcian Blue 8GX respectively. Scale bar: 100 μm. (C) The adipogenic (above), osteogenic (middle) and chondrogenic (below) differentiation degree was quantified by determining the absorbance of the extracts at 490 nm (Oil Red O and Alizarin Red S staining) and at 600 nm (Alcian Blue 8GX). Four independent experiments using four different cell lines were performed and a Mann-Whitney U test was used. p-values are shown in the figure.

