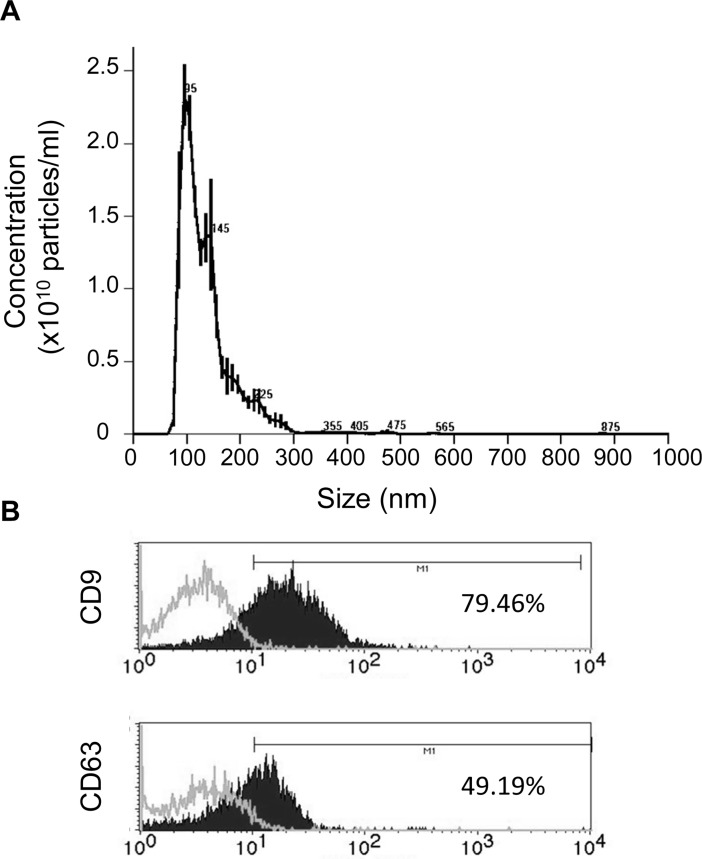
Fig 3. Characterization of EV-endMSCs.
(A) Representative graph of nanoparticle tracking analysis to quantify size distribution and particle concentration of EV-endMSCs. (B) Flow cytometry analysis on EV-endMSCs for exosomal markers CD9 and CD63. A representative histogram together with the expression levels is shown. The expression of cell surface markers is represented as as the percentage of positive cells (black lined histogram) above the negative control (grey lined histogram).

