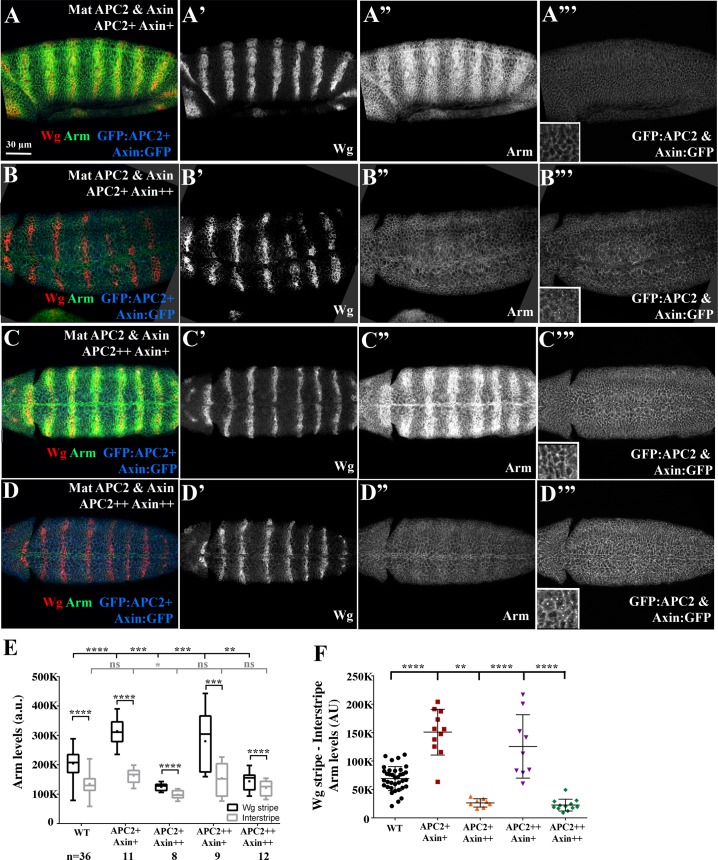
Fig 7. The relative ratios of APC2 to Axin levels determine effects on Arm destruction.
(A-D) Fixed stage 9 embryos. Anterior to the left. Representative images of the four different categories of the Mat APC2 & Axin phenotypes from Fig 6. Images were taken under the same microscope settings. Insets are close-ups. See Fig 6A for key to identifying presumptive genotype. (A,C) Both genotypes in which GFP:APC2 elevation exceeds that of Axin:GFP have elevated Arm accumulation in Wg stripes. (B,D) Both genotypes with the highest levels of Axin:GFP have reduced Arm accumulation in Wg stripes. (E) Effects on Arm accumulation in Wg stripes or interstripes in embryos with different ratios of Axin and APC2 accumulation-criteria used to distinguish embryos are in Fig 6. Box and whisker plot (as in Fig 4I and 4K), Arm accumulation in Wg-expressing stripes versus Arm in the interstripes. Wildtype and different presumptive genotypes of Mat APC2&Axin embryos imaged on the same slide. (F) Difference in Arm accumulation between Wg stripes and interstripes within individual embryos. Statistical analysis, a paired t-test was used to determine the significance between intragroup values in E, and an ordinary one-way ANOVA followed by Dunnett's multiple comparisons test was applied between intergroup values in E and F. ns, not significant i.e. p≥ 0.05. ** = p<0.01. *** = p<0.001. **** = p<0.0001.

