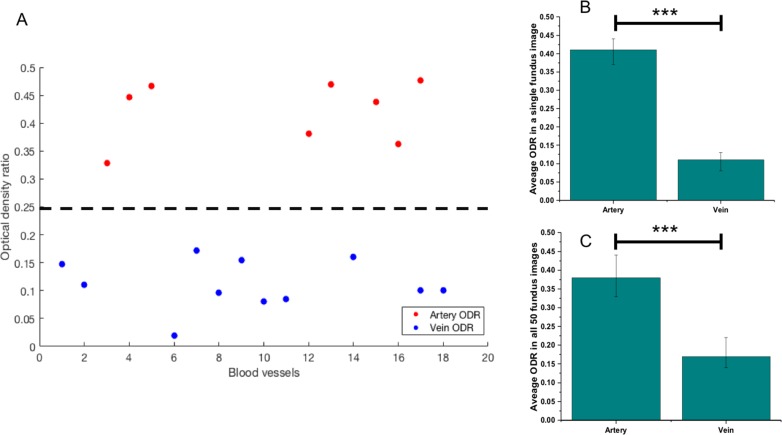
Figure 3.
Comparing ODR in arteries and veins. (A) Scatter plot illustrates ODR values of identified blood vessels in perifoveal retina of a single fundus image. A threshold can be added easily to clearly distinguish arterial and venous ODRs. (B) Average arterial and venous ODR values in a single fundus image. (C) Average arterial and venous ODR values for 50 fundus images used in this study. The average values are presented with corresponding standard deviations. ***P < 0.001 from Student's t-test.

