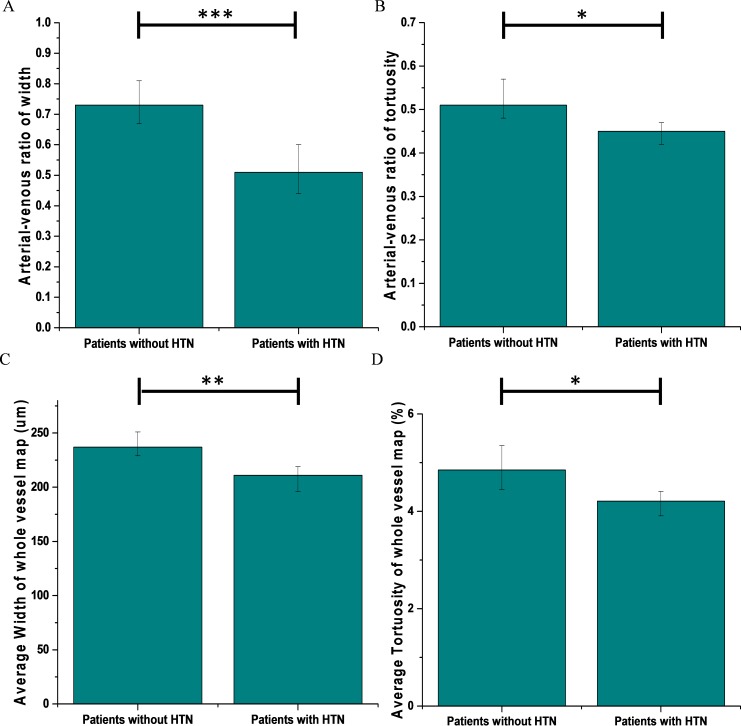
Figure 7.
Quantitative comparison between patients without hypertension and with hypertension. (A) A-V caliber ratio. (B) A-V tortuosity ratio. (C) Average caliber of the whole vessel map. (D) Average tortuosity of the whole vessel map. Error bars are standard deviations; the significance of Student's t-test is marked as *P < 0.05; **P < 0.01; ***P < 0.001.

