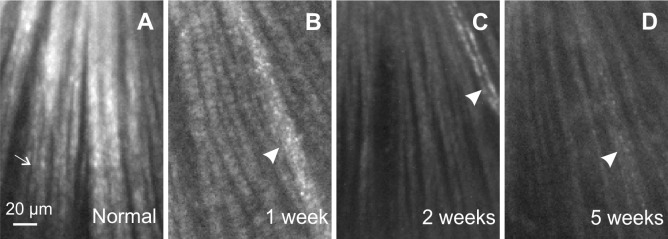
Figure 5.
Reflectance images of a normal retina and retinas with ONC. All images were taken at 500 nm and are displayed with the same contrast setting. Most of the bundles were measured at near maximum (on-peak) reflectance, except for a few bundles (thin arrow in A) with off-peak reflectance where the tissue curved. (A) Normal bundles appear as bright stripes against a dark background. (B–D) Bundles in retinas with ONC appear dimmer. Arrowheads: blood vessels.

