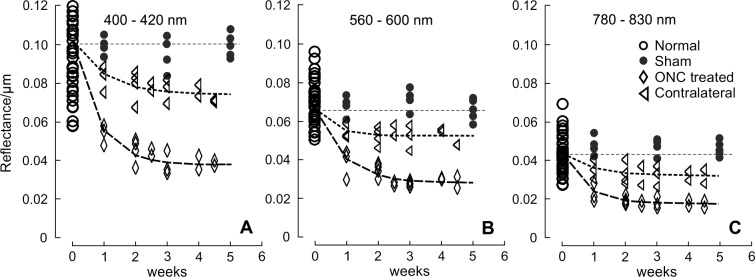
Figure 7.
RNFL reflectance per thickness (σ) in retinas with ONC and contralateral untreated retinas. σ decreased over time and at all studied wavelengths for the ONC treated and untreated groups. Curves: fitting with the exponential function  + C, where t is time with the normal data used for t = 0. The fitting results are in Table 4. Horizontal dashed lines: the mean σ of normal RNFL.

