
Figure 1.
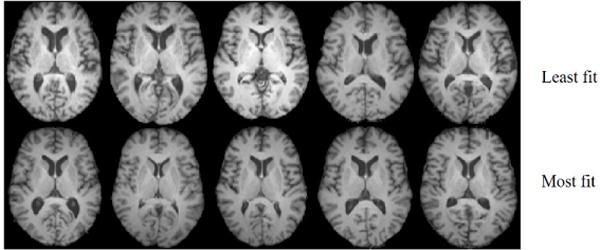
MR images belonging to 10 older adults in their 6th or 7th decades of life. The corresponding axial slice is depicted for each subject for comparison. The dataset from which the images are drawn is described further in 5.1.1. The images correspond to subjects who are +σ above the population mean aerobic fitness (most fit) or −σ below the mean aerobic fitness (least fit) as assessed by vO2 L/min. Prior groups have reported differences in quantitative tissue density [2], brain volume [3], as well as hippocampal volume [1] as a function of fitness on a subset of images from the same dataset. The goal is to determine whether there is a common morphologic feature that separates these groups, and if so, visualize it in a physically interpretable manner.