
Fig. 6.
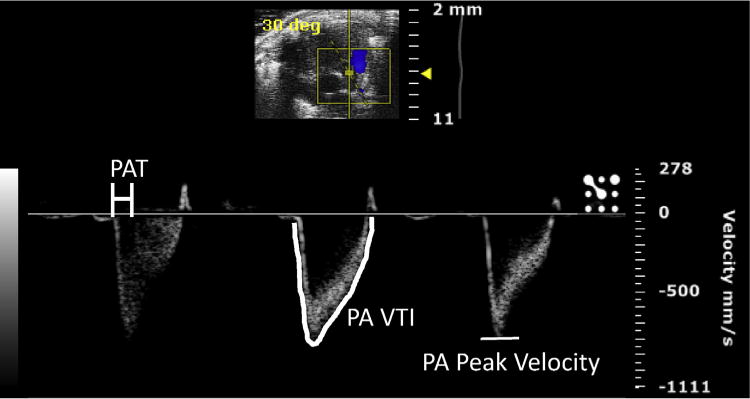
Color Doppler image of flow through the pulmonary artery (PA), used to calculate pulmonary arterial acceleration time (PAT), measured as the time elapsed between the beginning of the waveform to the point of PA peak velocity, PA velocity time integral (VTI), and PA peak velocity. (Color version of figure is available online.)