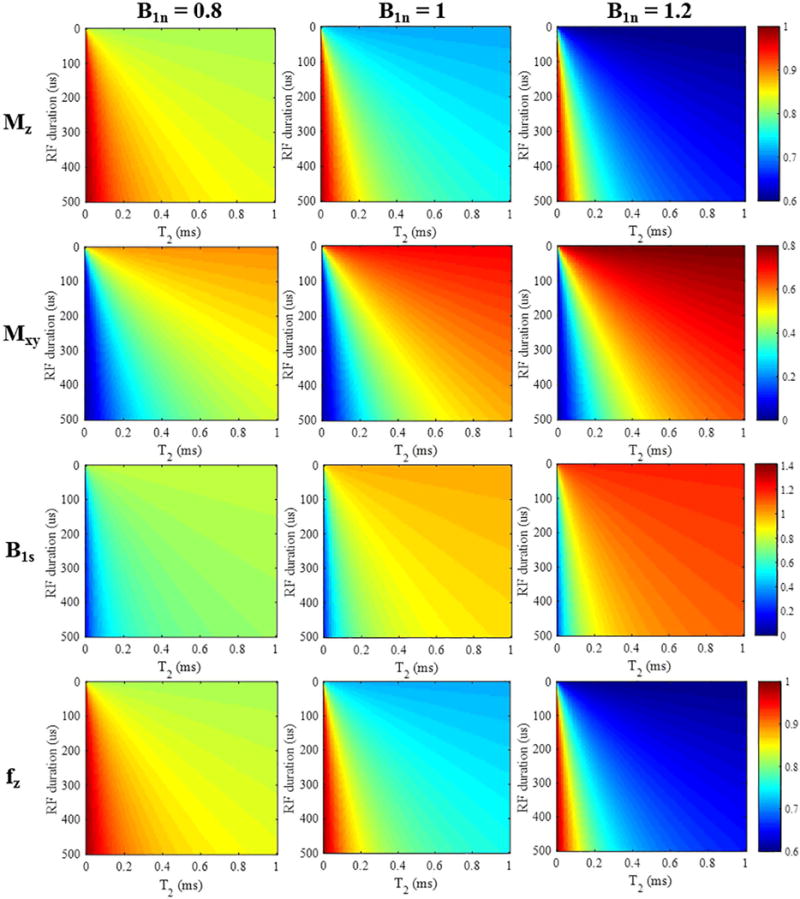
Figure 2.

Simulation results for short T2 tissues (T2s from 0 to 1 ms) with a rectangular RF pulse excitation (durations from 0.1 to 500 μs). The top two rows show color maps corresponding to the longitudinal and transverse magnetizations (i.e. and ) calculated from Eqs. [3] and [4]. The third row shows the resulting B1s scaling factors, and the bottom row shows the mapping function obtained by the AFI method. The columns represent simulation results with nominal B1 scaling factors B1n of 0.8, 1, and 1.2, respectively.
