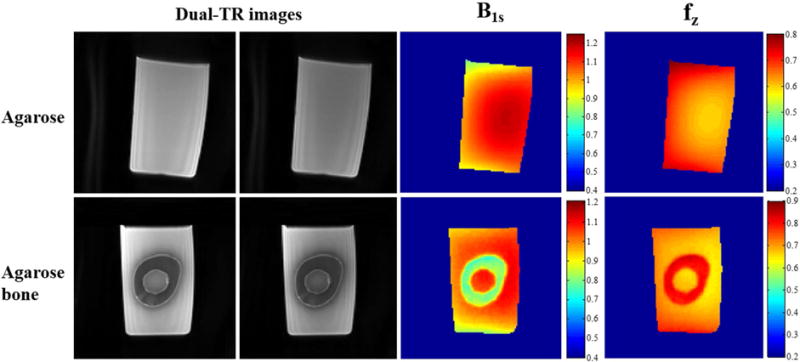
Figure 4.

Phantom results using the 3D UTE-Cones-AFI technique and an 8-channel knee coil. The first two columns show dual-TR UTE-Cones images (left: first TR images; right: second TR images) of an agarose phantom and an agarose bone phantom, who’s B1s and maps are shown in right two columns, respectively. As can be seen from the results of agarose phantom, higher B1s is observed in the center area of the knee coil. However, the bone region in the agarose bone B1s map shows a much reduced B1s values due to inefficient excitation of the short T2 tissue.
