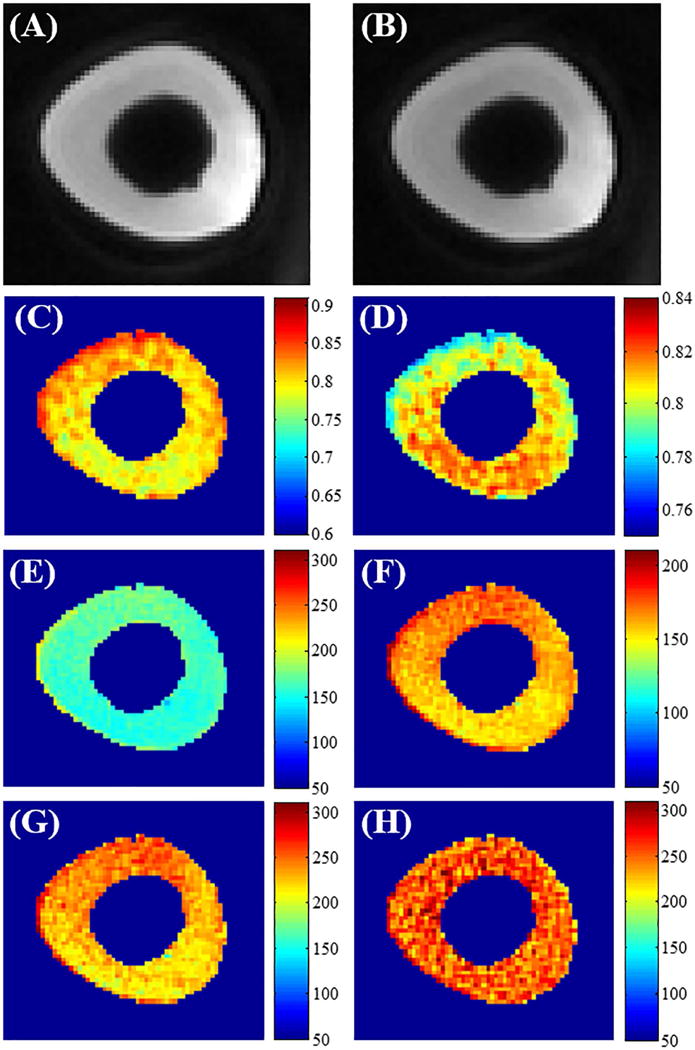
Figure 6.

The effect of RF pulse duration on bovine cortical bone T1 measurement using the VTR method. A longer rectangular RF pulse duration of 150 μs with a flip angle of 45° was used in panels A to F. Panels A and B are cropped sections from the 3D UTE-Cones AFI images with a TR of 20 ms (A) and a TR of 100 ms (B). The B1s map (C) and the map (D) were calculated from these dual TR images. Panels E and F show the T1 maps obtained using the regular VTR method. The panels display a different color range. Panel G shows the T1 map generated with the regular VTR method using a shorter RF pulse of 60 μs and flip angle of 20°. This shows increased T1 values relative to E but a similar T1 spatial distribution similar to F. Panel H is the T1 map obtained by the 3D UTE-Cones AFI-VTR method. This shows a much more homogeneous T1 distribution.
