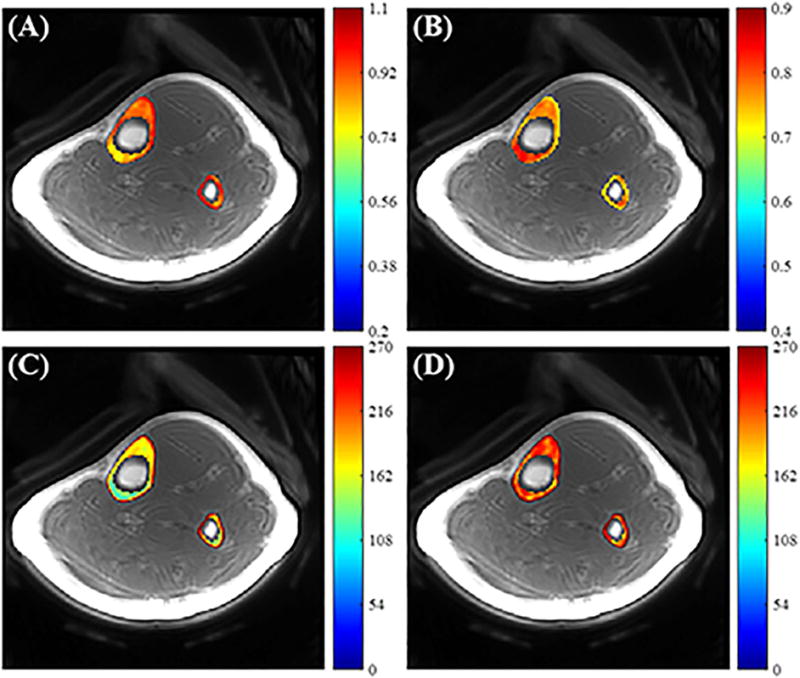
Figure 8.

In vivo tibial cortical bone results. Panels A and B show the B1s and maps calculated from 3D UTE-Cones dual-TR images, respectively. Panels C and D show the T1 maps generated using the uncorrected VTR method (C) and using the proposed UTE-Cones AFI-VTR method (D), respectively. The T1 map appears more uniform in (D).
