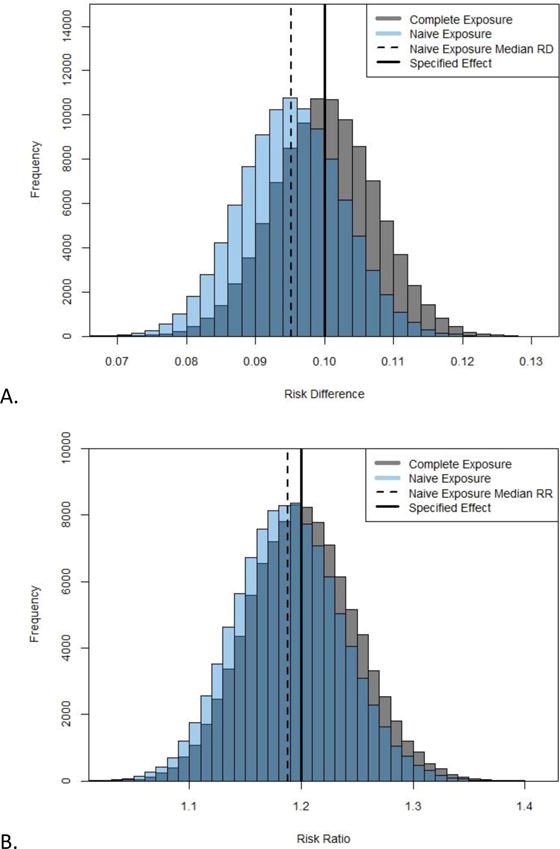
Figure 3.

A) Risk differences from simulation with 100,000 replications using complete and naïve exposure estimates for all children (specified risk difference = 0.10). B) Risk ratios from simulation with 100,000 replications using complete and naïve exposure estimates for all children (specified risk ratio = 1.2).
Complete exposure estimates are calculated as a weighted average of time spent at each residence during the prenatal period, naïve exposure estimates are calculated assuming residence at birth applied to entire prenatal period.
REFERENCES: 1. Georgia Department of Public Health, Office of Health Indicators for Planning (OHIP). Online Analytical Statistical Information System: Demographic Clusters of Georgia: Accessing the Georgia Department of Public Health’s Data Warehouse. Available from: https://oasis.state.ga.us/gis/demographiccluster/DemoClusters2011.htm. Accessed April 11 2016.
