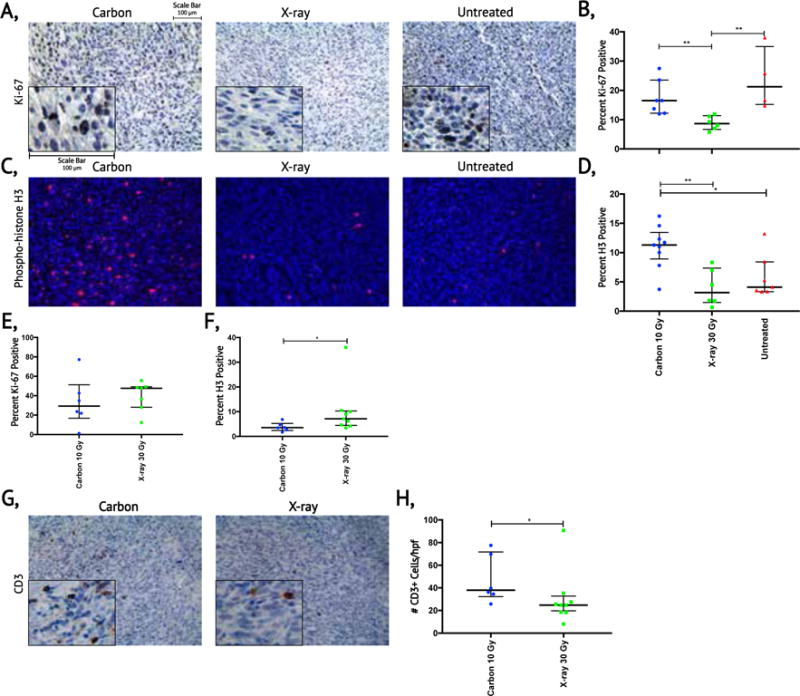
Figure 5. Assessment of tumor cell proliferation and T-cell infiltration after carbon ion or X-ray radiotherapy.

(a) Evaluation of proliferation by Ki-67 immunohistochemistry in sarcomas treated with 10 Gy carbon ions, 30 Gy X-rays, and untreated sarcomas when tumor volume approached the limit of the IACUC protocol. (b) Quantification of Ki-67 staining for sarcomas that reached the experimental endpoint in each treatment group. (c) Evaluation tumor cells in G2 and mitosis by immunofluorescence of phospho-histone H3 in sarcomas treated with 10 Gy carbon ions, 30 Gy X-rays and untreated sarcomas when tumor volume approached the limit of the IACUC protocol. (d) Quantification of phospho-histone H3 staining for sarcomas that reached the experimental endpoint in each treatment group. (e) Quantification of Ki-67 staining for sarcomas at 24 or 48 hours after 10 Gy carbon ions and 30 Gy X-raysΔ. (f) Quantification of phospho-histone H3 staining for sarcomas at 24 or 48 hours after 10 Gy carbon ions and 30 Gy X-raysΔ. (g) Evaluation of T-cell infiltration in sarcomas proliferation by CD3 immunohistochemistry at 24 or 48 hours after 10 Gy carbon ions and 30 Gy X-rays. (h) Quantification of infiltrating T-cells in sarcomas at 24 or 48 hours after 10 Gy carbon ions and 30 Gy X-raysΔ. Median values (thick black lines) and IQR (thin black error bars) shown; statistical significance evaluated with Mann Whitney U test. *p< 0.05, **p<0.01. Δ refer to Supplementary Figure 2 for breakdown of 24 and 48 hours. Scale bar = 100 microns.
