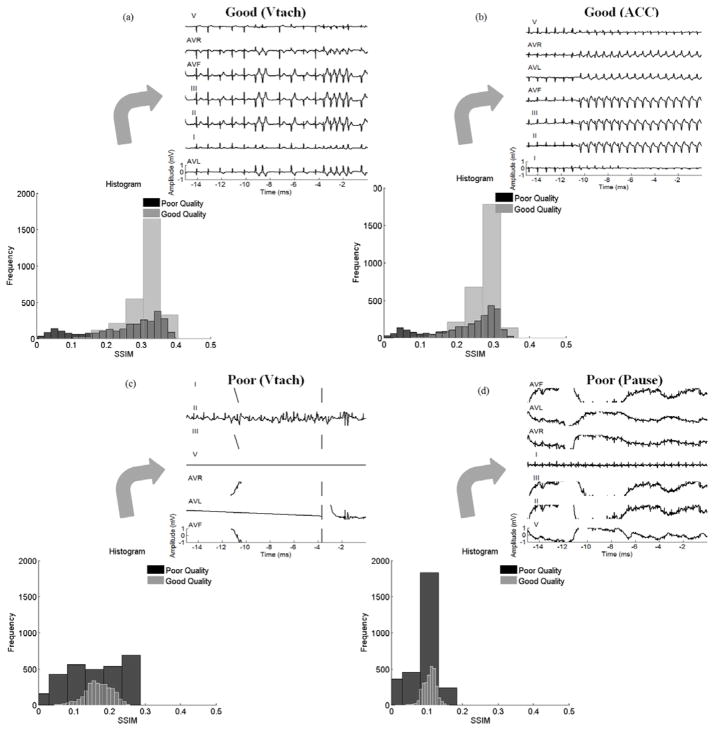
Fig. 3.
SSIM histogram between poor and good quality images for two sample templates with good and poor qualities. (a), and (b) show the SSIM histogram between the images from each group with two sample templates annotated as good quality (a) related to VTach alarm and (b) related to ACC alarm. (c), and (d) show the SSIM histogram between the images from each group with two sample templates annotated as poor quality (c) related to VTach alarm and (d) related to Pause alarm.

