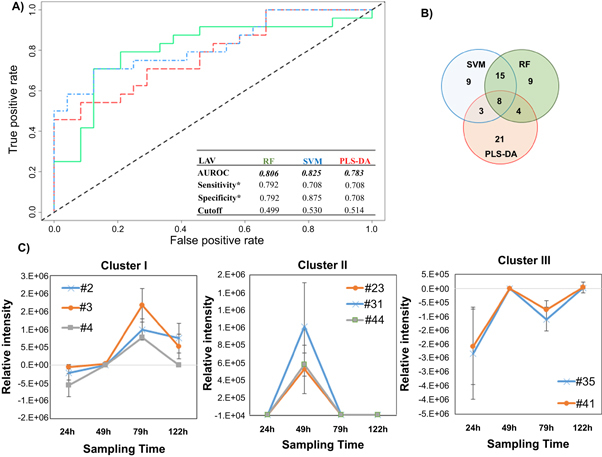
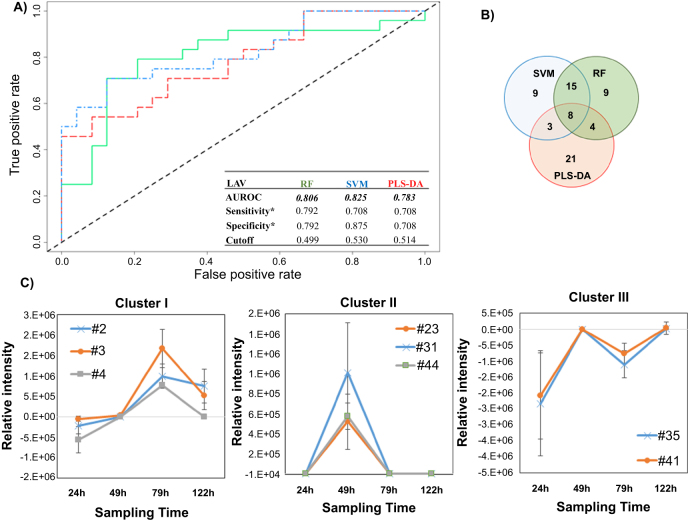
Figure 2.

Differential production of volatile metabolites by IAV-infected and uninfected MLE-Kd cells. (A) ROC curve for the discrimination between infected and uninfected cells using random forest (RF, green line), support vector machines with a linear kernel (linear SVM, blue line), and partial least-squares discriminant analysis (PLS-DA, red line). *Optimal sensitivity and specificity of each statistical model are calculated at the given class prediction cutoff (ranging from 0 to 1). (B) Venn Diagram of the top 20% features selected as the most discriminatory between IVA-infected cell line and uninfected control using RF. SVM, and PLS-DA algorithm. (C) Most significant clusters obtained by k-Means Clustering analysis of the difference between infected and uninfected cell cultures. Remaining cluster is reported in supplementary figure 4. # features codification as in table 1.


