
Figure 4. THAL-SNS-032 exhibits transcriptional effects consistent with a selective CDK9 inhibitor.
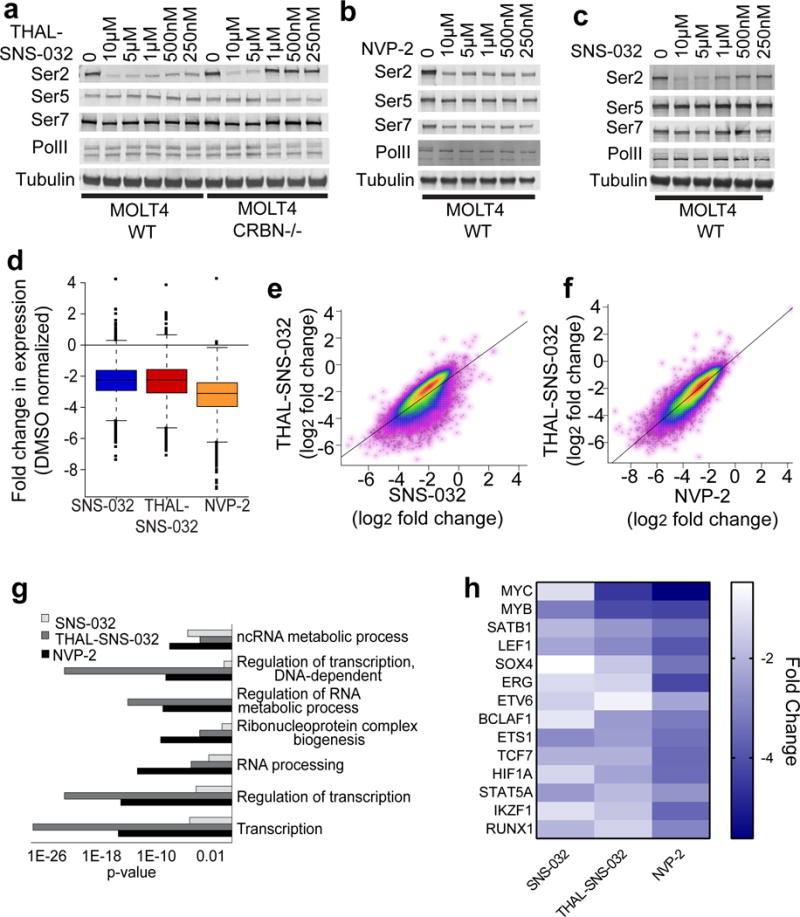
a. Immunoblot of proteins shown after treatment of wildtype and CRBN−/− MOLT4 cells with THAL-SNS-032 at the concentrations indicated for 6 hours. b. Immunoblot of proteins shown after treatment of wildtype MOLT4 cells with NVP-2 at the concentrations indicated for 6 hours. c. Immunoblot of proteins shown after treatment of wildtype MOLT4 cells with SNS-032 at the concentrations indicated for 6 hours. d. Box plot analysis of changes to gene expression levels in MOLT4 cells after treatment with 250nM THAL-SNS-032, SNS-032 or NVP-2 for 6 hours e. Scatter plots showing the correlation of transcriptional changes in MOLT4 cells when treated with THAL-SNS-032 or SNS-032 at concentrations of 250 nM. f. Scatter plots showing the correlation of transcriptional changes in MOLT4 cells when treated with 250nM THAL-SNS-032 or 250nM NVP-2. g. p-value resulting from GO term analysis of genes downregulated by treatment with NVP-2 (1018 genes), THAL-SNS-032 (1026 genes) or SNS-032 (1013 genes). h. Heatmap of gene expression changes to the core regulatory circuitry genes after treatment with NVP-2, THAL-SNS-032, or SNS-032. Uncut western blots are in Supplementary Figure 7.