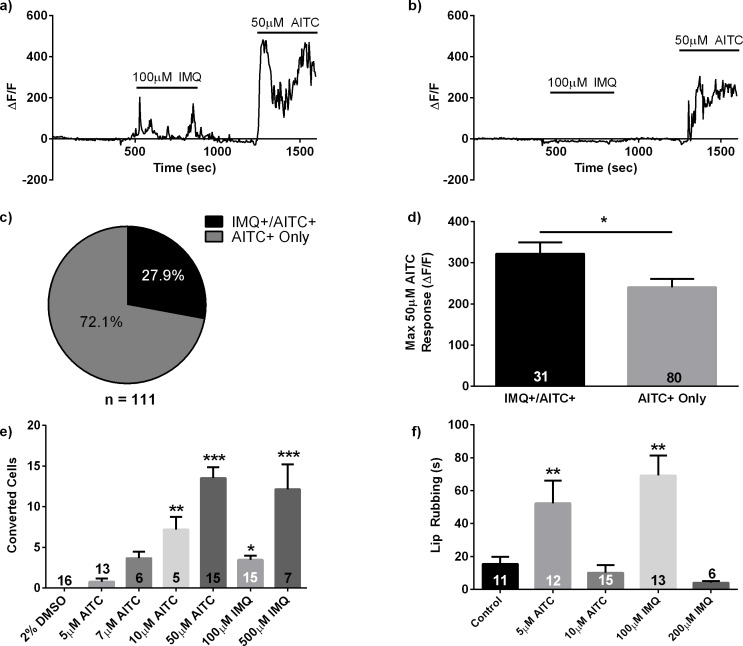
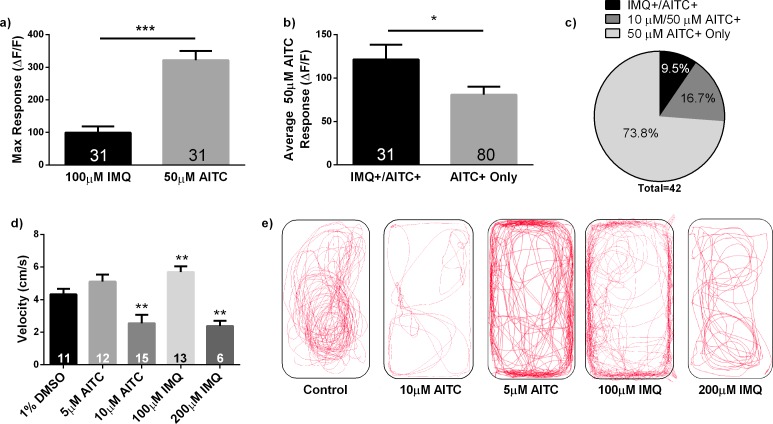
Figure 4. Imiquimod responsive cells are a primed subpopulation of TRPA1 positive cells and stimulus intensity affects behavioral and neuronal responses.
(A, B) Representative traces from calcium imaging experiments in 3dpf elavl3:H2BGCaMP6 zebrafish exposed to 100 μM IMQ and 50 μM AITC. An IMQ+/AITC+ TG neuron is shown in (A), while an AITC+ only neuron is shown in (B). (C) Quantification of neuronal subtypes within AITC+ neurons. n = 31 IMQ+/AITC+ neurons, n = 80 AITC+ only neurons. (D) Comparison of the maximum ΔF/F during the 50 μM AITC stimulus between neuronal subtypes. (E) Number of photoconverted neurons in 3dpf elavl3:CaMPARI zebrafish TG following stimulation with TRPA1 agonists. (F) Quantification of lip-rubbing behavior in adult zebrafish following exposure to TRPA1 agonists. Bars represent means ± s.e.m. *p<0.05, **p<0.01, ***p<0.001, Student’s t-test (D), one-way ANOVA (E, F).


