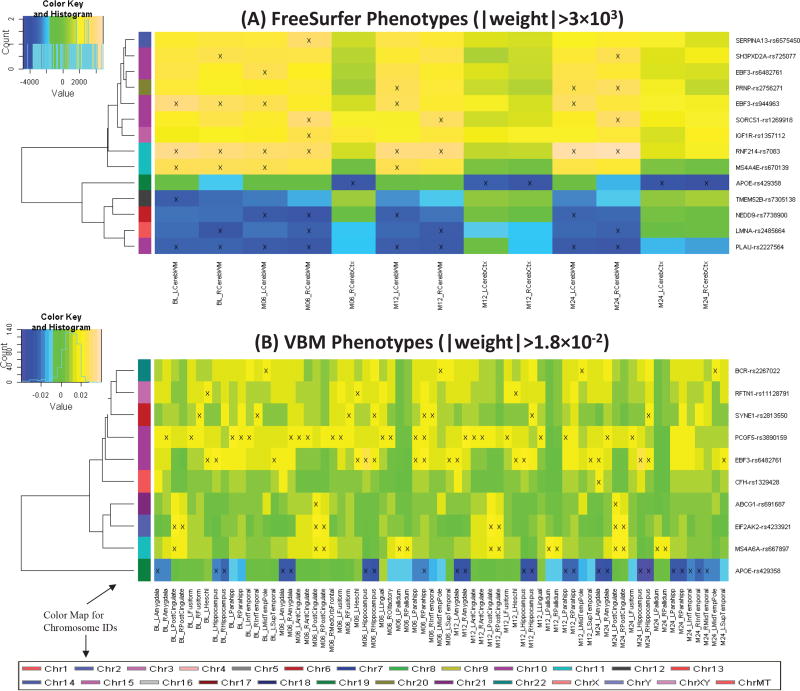
Fig. 3.
Heat maps of top regression weights between quantitative traits (QTs) and SNPs filtered by a user-specified weight threshold: (A) FreeSurfer QTs and (B) VBM QTs. Weights from each regression analysis are color-mapped and displayed in the heat maps. Heat map blocks labeled with “x” reach the weight threshold. Only top SNPs and QTs are included in the heat maps, and so each row (SNP) and column (QT) have at least one “x” block. Dendrograms derived from hierarchical clustering are plotted for SNPs. The color bar on the left side of the heat map codes the chromosome IDs for the corresponding SNPs.

