

Abstract
Polydimethylsiloxane (PDMS) membranes can act as sensing elements, barriers, and substrates, yet the low rigidity of the elastomeric membranes can limit their practical use in devices. Microraft arrays rely on a freestanding PDMS membrane as a substrate for cell arrays used in imaging cytometry and cellular isolation. However, the underlying PDMS membrane deforms under the weight of the cell media, making automated analytical microscopy (and thus cytometry and cell isolation) challenging. Here we report the development of microfabrication strategies and physically motivated mathematical modeling of membrane deformation of PDMS microarrays. Microraft arrays were fabricated with mechanical tension stored within the PDMS substrate. These membranes deformed 20× less than that of arrays fabricated using prior methods. Modeling of the deformation of pretensioned arrays using linear membrane theory yielded ≤15% error in predicting the array deflection and predicted the impact of cure temperatures up to 120 °C. A mathematical approach was developed to fit models of microraft shape to sparse real-world shape measurements. Automated imaging of cells on pretensioned microarrays using the focal planes predicted by the model produced high quality fluorescence images of cells, enabling accurate cell area quantification (<4% error) at increased speed (13×) relative to conventional methods. Our microfabrication method and simplified, linear modeling approach is readily applicable to control the deformation of similar membranes in MEMs devices, sensors, and microfluidics.
Graphical Abstract
Thin membranes are critical components in physical sensors, bioanalytical devices, and micro-electromechanical systems (MEMS) devices, often exhibiting unique properties that depend on their material composition and geometry. Microscale elastomeric membranes, specifically those made from polydimethylsiloxane (PDMS), have been widely adopted for their desirable properties, since PDMS is gas permeable, optically clear, and biocompatible. Additionally, PDMS is able to undergo large reversible deformations, reseal naturally after punctures, and be rapidly prototyped. PDMS membranes are found as central components for many devices in diverse roles including adaptive lenses, soft cell-culture surfaces, selective gas separators, and tunable optical gratings.1–4 For microdevices, specifically, PDMS membranes have been used as biocompatible coatings, observation windows, and microfiltration interfaces.5–8 Thin PDMS membranes have also become established as substrates for microarrays, since they are readily paired with optical assays and various cell types.9,10 The beneficial properties of PDMS membranes enables them to act as critical design elements in a remarkably wide range of applications.
One drawback shared by most thin films and membranes, including PDMS membranes, is their low mechanical rigidity, which limits their durability and makes control over their spatial orientation challenging. Membrane design and performance have been recognized to be device- and application-dependent.11 Some strategies adopted to address the deflection of PDMS microarrays and membranes include thickening the membrane or otherwise incorporating solid substrates or support beams.6,9 However, these strategies come with trade-offs: thicker membranes have poorer imaging and gas transport properties, and it is not always possible to include auxiliary supports to the membranes without reducing the functionality of the membrane. For optical applications, in particular, there is a need to use exceptionally thin substrates that maintain flatness. For example, Raman microscopy of cells relies on the detection of inherently weak spectra and benefits from situating samples on thin substrates to enable the use of low working distance and high numerical aperture objectives that improve the signal-to-noise ratio.12 Yet, the deformation of such thin PDMS substrates would make the focused acquisition of signals from multiple positions on the membrane practically infeasible. Overall, it is challenging to control PDMS membrane deflection without imposing limitations on the desired function of the membrane.
Microraft arrays are specialized microarrays with applications in cytometry and cell sorting.13,14 These arrays are particularly sensitive to deformation, because they rely on a thin, freestanding PDMS membrane as a substrate. Microraft arrays are uniquely capable of efficiently sorting of cells based on complex spatiotemporal phenotypes without impacting cell viability.15,16 The arrays also have applications in sorting small sample sizes or extremely rare cells as well as fragile cell types such as primary cells.17,18 Microraft arrays contain ≥103 microscale magnetic polystyrene, cell-culture elements called “microrafts,” each situated within a square microwell in a thin PDMS membrane. However, the PDMS microarray membrane, which is 80 times as wide as it is thin, experiences deflection under the load of cell-culture media, and the resulting curved microarray surface poses significant challenges for microscopy imaging, cytometry, and cell sorting (Figure 1). Microraft arrays can function as cell sorting devices but only if the bottom of the membrane is freely accessible by the microneedle used to isolate individual microrafts (Figure 1C). Thus, the use of support structures or the addition of pressurization below the membrane to oppose the deflection are not viable options. Previous approaches to compensate for the deflection have included: manual refocusing of the array during imaging, using low numerical aperture (NA) and magnification objectives for imaging, using cyclic olefic copolymer (COC) as the array substrate, and using glass supports; yet these approaches have not been universally effective.
Figure 1.

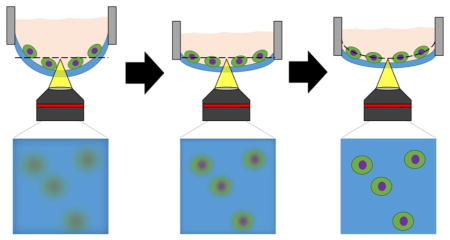
Introduction to microraft arrays. (A) Photograph of a freestanding microraft array membrane (left) and a finalized microraft array attached to a media chamber cassette (total ruler length shown = 11 cm). (B) Isometric view (top) and cut-away view (bottom) of a simplified schematic of a microraft array device (not drawn to scale). Approximately 12 000 microrafts, each 200 × 200 × 70 μm in size, are molded into a thin 24 × 24 × 0.3 mm PDMS membrane, which spans a square chamber. Microrafts: red; PDMS: blue; media chamber: gray. (C) The PDMS membrane deforms under the load of liquid media (pink). The two main functions of the microarray are microscopic cytometry (i) and cellular isolation (ii), which require access to the bottom of the membrane to position an objective near the array for imaging (i) or to actuate a microneedle to dislodge microrafts for isolation (ii).
Few options exist to reduce the deformation of thin membranes. Examples include increasing the thickness/length ratio of the membrane, increasing material stiffness, or introducing tension to the membrane; however, for many microdevices, including microraft arrays, the membrane geometry and membrane material choice are tightly constrained design parameters. Here, we describe a method to flatten thin membranes by storing thermal energy within the membrane during fabrication. Additionally, we develop an analytical model describing the deflection of square microarray membranes under a static load and use the model to develop minimally deflecting microarrays. This tension model was used to guide materials selection and geometric and fabrication parameters for microraft arrays. We also extensively validate the theoretical model against experimental measurements of microarrays fabricated on a variety of thin PDMS membranes. Finally, the tension model was incorporated into automated microscopy imaging of cells arrayed on a thin membrane substrate, enabling rapid and accurate focusing for automated cytometry. The fabrication method for membranes with thermally induced tension and the modeling approach for pretensioned membranes have wide applicability to the fabrication and optimization of microdevices using vulcanizable thin films, particularly when paired with optical-based assays.
EXPERIMENTAL SECTION
Materials
Sylgard 184 PDMS was prepared from a silicone elastomer kit (Dow Corning, Midland, MI). EPON Resin 1002-F was purchased from Hexion, Inc. (Columbus, OH). Octyltrichlorosilane (97%) was purchased from Sigma-Aldrich (St. Louis, MO). Poly(acrylic acid) (30 kDa) was purchased from Polysciences, Inc. (Warrington, PA). Wild-type H1299 cells originally from ATCC (Manassas, VA) were altered to stably express green fluorescent protein (GFP) in previous work.19 RPMI-1640 culture media, fetal bovine serum (FBS), and penicillin/streptomycin were obtained from Thermo Fisher Scientific (Waltham, MA).
Microraft Array Fabrication
Microraft arrays utilizing a sacrificial glass backing to transfer the array membrane onto a media chamber were fabricated as reported previously.18 1002-F negative photoresist master templates consisting of 100 μm tall, 200 × 200 μm pillars on glass separated by 30 μm were fabricated and covalently modified with octyltrichlorosilane to reduce adhesion. Sacrificial rigid substrates for the microarrays were prepared by spin-coating a thin layer of poly(acrylic acid) onto glass slides at 1500 rpm for 30 s. PDMS was poured into the master template and degassed before a sandwich was formed with the sacrificial rigid backing. The assembly was cured at ≥95 °C for 40 min. Demolding the glass-backed PDMS from the silanized template resulted in a microwell array, which was then dip-coated in magnetic polystyrene solution consisting of 18% mass/mass poly(styrene-co-acrylic acid) doped with Fe2O3 nanoparticles in gamma butyrolactone. Beads of polystyrene left in each well by discontinuous dewetting from the hydrophobic PDMS formed microrafts after baking off the solvent at 95 °C. The microraft arrays were oxygen plasma treated (Harrick Plasma) for 3 min prior to being secured to polycarbonate cassettes using PDMS glue, cured at 70 °C for 3 h or room temperature for 48 h, and the sacrificial glass backings were removed by soaking the backing in DI water at 70 °C overnight or for 24 h at room temperature to dissolve the PAA.
Control “nontransferred” microraft arrays were fabricated without the use of a sacrificial rigid substrate, i.e., the array was maintained as a freestanding membrane throughout the microfabrication process as previously reported.14 Briefly, after degassing Sylgard 184 over 1002-F master templates, the PDMS was spin-coated to the desired thickness and then cured, demolded, dip-coated, baked, and secured to media chambers as described above.
Deformation Measurements
Deformation measurements of the microraft array were taken using an image-based “shape-from-focus” (SFF) routine on a motorized Olympus IX81 inverted microscope (4× objective, N.A. of 0.13, Olympus UPlanFLN). SFF aims to determine the shape of the surface of an object by estimating the best-focused depth of images on a surface.20 Image-based SFF was performed by autofocusing on images of the microarray at each position of a (x,y) coordinate grid spanning the array. The software autofocus was implemented as a bounded maximization of the image gray-level variance as a function of focal position using MATLAB’s fminbnd function (Optimization Toolbox).21 SFF autofocusing scans were automated by MATLAB scripts harnessing the open-source Micromanager API for control of microscopy hardware. Deformation measurements were acquired at 0, 3, and/or 6 mL of media loading within a controlled 60% humidity environment to minimize evaporation. With use of a 2.2 × 1.7 mm FOV, point clouds consisting of 23 × 14 spatial positions spanning the whole microraft array were recorded within 30 min with a measurement standard deviation of 7.2 μm along the focal (Z) axis.
Automated Image Acquisition and Analysis
Microrafts arrays were scanned using custom MATLAB microscopy automation software controlling a motorized inverted IX81 microscope with open-source Micromanager drivers. Fluorescence imaging of EGFP and Hoechst 33342 was performed using FITC (Semrock FITC-3540B) and DAPI (Chroma ET-DAPI 49000) filter sets. Microrafts and cells were segmented from brightfield and fluorescence images using a combination of intensity thresholding and morphological filtering. Cell nuclei were counted using peak finding (“Fast 2D peak finder” MATLAB File Exchange File # 37388) on images of Hoechst 33342 fluorescence intensity.
Statistics
Measurements are reported as the average ±1 sample standard deviation unless otherwise noted. All statistically tests were performed at the 5% significance level.
RESULTS AND DISCUSSION
Membrane-Based Microarray Deformation Properties under an External Load
The deformation of microraft array membranes under cell-culture media poses a substantial barrier to imaging cytometry, since different regions of the array will reside in different focal planes (Figure 2A,B). To investigate the extent of microraft array deformation, microarrays were fabricated using two previously reported microfabrication strategies and subjected to deformation tests.18,22 In the first fabrication strategy, PDMS prepolymer was spin-coated on the surface of a micropost array template (Figure 2C-i). After curing, the PDMS mold with imprinted microwells was removed from the template (Figure 2C-ii). To form the rafts or elements within the microwells on the PDMS membrane, the arrays were dip-coated into a polystyrene solution and baked overnight (Figure 2C-iii). The completed microraft array was attached to a plastic media chamber with PDMS glue, and aqueous solution was placed onto the array (Figure 2C-iv,v). In a second strategy, the PDMS prepolymer was spin-coated on the surface of a micropost array template, but prior to curing, a glass slide with a surface coating of a sacrificial layer (poly(acrylic acid)) was placed onto the exposed PDMS (Figure 2C-i). The assembly was then cured with the sacrificial layer in contact with the PDMS (Figure 2C-ii). After curing, the microwell-imprinted PDMS was removed from the micropost template but remained in contact with the PAA-coated slide (Figure 2C-iii). A media chamber was attached to the PDMS surface, and then, the sacrificial PAA layer was removed by immersing the assembly in an aqueous solution to dissolve the PAA (Figure 2C-iv,v). Microarrays fabricated without the sacrificial layer (“nontransferred arrays”) demonstrated a maximal transverse deformation of 1722 ± 89 μm (±1 standard deviation, N = 3) under an aqueous load (3 mL over a 24 × 24 cm2 area). However, microarrays transferred to media chambers using the sacrificial substrate (“transferred arrays”) exhibited significantly lower deformations with a maximal transverse deformation of 143 ± 10 μm (N = 3, p < 10−5 by unpaired two-tailed t test). Curing the arrays with identical geometry comprising an identical material (PDMS) over a sacrificial layer on a glass slide led to a substantial flattening of the array.
Figure 2.

Deformability of nontransferred and transferred microraft arrays. (A,B) Transmitted light microscopy images of microraft arrays made from nontransferred (A) and transferred (B) arrays. The arrays were imaged in a single microscopy focal plane (4× magnification, NA = 0.13, DOF ≈40 μm). Red borders mark images visually judged to be out of focus, while green borders mark images that were judged to be in focus. (C) Schematic of nontransferred and transferred microraft arrays. i: PDMS (blue, darker shades indicate cured PDMS) is shaped with a micromold (orange). A glass slide (white) with a sacrificial coating (purple) is pressed onto the uncured PDMS for the transferred array fabrication strategy. ii: PDMS thermally expands prior to solidification and then shrinks after cooling (nontransferred) or remains expanded after cooling (transferred). iii: Microrafts (red) are microfabricated. iv: A media chamber (black) is glued to the array, and for transferred membranes, the solid support is then removed. v: Aqueous media (pink) is placed onto the array.
Thermally Induced Mechanical Tension as a Mechanism for Microraft Array Bending Resistance
We hypothesized that mechanical tension stored within the PDMS membrane during curing on the glass slide might account for the more than 10-fold reduction in deformation for the transferred membranes compared to that of the non-transferred membranes. The reduction in deformation in transferred membranes was independent of microraft or microwell features. No statistically significant difference was observed between the deformation of transferred featureless PDMS membranes, transferred PDMS microwell arrays, and transferred microraft arrays (deformations: 129 ± 2, 160 ± 22, and 143 ± 10 μm, respectively, N = 3, p > 0.08 by one-way ANOVA). To assess the presence of stored tension in transferred microarrays, transferred microarray membranes were peeled from their media cassette, and then, the membrane and cassette were reglued. The average deformation of the “peel-and-replace” microarrays increased significantly after releasing and replacing them onto their media chambers (from 143 ± 10 to 1085 ± 103 μm, N = 3 per condition, p < 0.005 by paired two-tailed t test). A similar increase in deformation was observed in membranes that were released from their solid substrates during microfabrication and then retransferred to cassettes (deformation of 1293 ± 301 μm, N = 3, p < 0.003 by unpaired two-tailed t test). In contrast, the deformation of nontransferred microarrays was unaltered when peeled and replaced (from 603 ± 45 to 511 ± 112 μm, N = 3, p > 0.14 by paired two-tailed t test). Taken together, these experiments indicate that tension is stored within transferred membranes and that this tension is stored prior to membrane transfer onto cassettes. Additionally, attachment to the cassette prior to release from the glass slide is critical to retain the stored tension.
We hypothesized that mechanical tension results from the thermal expansion of the PDMS array during microfabrication and that this tension is stored in the membrane of the transferred arrays but not the nontransferred arrays. Further, we propose that tension is introduced specifically during the thermal curing of the polydimethylsiloxane (PDMS) microarray (Figure 2C-ii). As the liquid PDMS prepolymer heats on a mold, the material thermally expands until it gels, at which point the solid PDMS microarray is held in an expanded state by adhesion to the sacrificial glass backing. Once cooled, tension is stored within the microarray while adhered to its substrate. After the microarray is transferred to a media chamber and removing the sacrificial substrate, the tension continues to be stored within the membrane.
Development of a Thermal-Tension Model for Thin Microarray Deflection
The proposed mechanism of thermal expansion-driven tension generation and storage in transferred arrays was mathematically modeled using linear membrane theory. The internal tension of the membrane, caused by residual thermal stresses from the manufacturing process, resists the deformation induced by the hydrostatic loading from the media (Figure 3A). The flexural rigidity of the membrane was neglected, enabling the use of a classical 2D Poisson model, eq S6, a partial differential equation that accurately models small deflections of a loaded membrane under tension with negligible bending resistance (Supporting Information). The model geometry was simplified by neglecting the presence of microrafts embedded in the membrane and assuming a homogeneous membrane cross section with geometrically averaged thickness. Further, the membrane material parameters were assumed to be independent of temperature. For a given loading, the maximal deflection, Zmmax, was predicted from the full solution, eq S8, to be reduced linearly by increasing the membrane’s curing temperature, thickness, or Young’s modulus and is given by
Figure 3.

Validation of physical model of transferred microraft array deflection. (A) Free-body diagram of transferred microraft arrays (not to scale). Transferred microraft arrays were modeled as simply supported plates of side length L of homogeneous thickness h under thermally induced tension T with uniformly distributed load P. (B) Visualization of the predicted and measured shape of transferred microraft arrays. For visualization purposes, the X-, Y-, and Z-dimensions were scaled to unit distances. (C) Measured and predicted cross section of microarrays (N = 23 arrays). The gray-shaded region represents a single standard deviation of the experimental data. (D) Comparison of the predicted and measured magnitudes of maximal microraft deflection of microraft arrays for conditions 1–4 of Table 2. (E) Comparison of the predicted and measured magnitudes of maximal microraft deflection of microraft arrays fabricated under conditions 5–7 of Table 2. The paired data points indicate paired deformation measurements recorded at 3 and 6 mL of loading.
| (1) |
where Δ is the difference between the cure temperature and the temperature of the application experiment, and h is the geometrically averaged thickness of the PDMS membrane. The material parameters E, α, and ν are the Young’s modulus, coefficient of thermal expansion, and Poisson’s ratio of the membrane, respectively. The full solution describing the deformation of pretensioned membranes, eq S8, was also linear, with a multiplicative prefactor. The linearity of the solution makes it highly tractable for modeling, because only one parameter needs to be fitted to fully describe the shape of the microarray under various conditions.
Validation of Physical Model of Microraft Array Deflection
The proposed linear model of thermally tensioned microarray deflection was validated by a measurement of the deformation of microraft arrays under different fabrication, material, and loading conditions (Table 1). The first condition consisted of microarrays made using standard conditions: PDMS at the standard 10:1 base/cross-linker ratio, molded into 300 μm thick membranes and cured at 95 °C. The remaining conditions increased the cross-linker concentration, membrane thickness, and/or cure temperature. Grids of positional data of the surfaces of microraft arrays in Conditions 1–8 were measured using automated microscopy (Figure 3B,C and Supp. Figure 1). In these experiments, the standard transferred microraft arrays exhibited a maximal deflection of 153 ± 24 μm (3 mL of media load, curing at 95 °C, Condition 1, Table 1). Array deformation was further reduced to 94 ± 2 μm in microarrays cured at 120 °C (Condition 2) and to 52 ± 5 μm for 1 mm thick microarrays (Condition 4). Membrane cure temperature was confirmed as a parameter impacting the deformation of transferred membranes.
Table 1.
Transferred Microraft Array Experimental Conditions
| condition | description | nominal PDMS thickness (μm) | temperature difference (°C)a | PDMS base/cross- linker | maximal deformationb (μm) |
|---|---|---|---|---|---|
| 1 | standard conditions | 300 | 58 | 10:1 | 153 ± 24 |
| 2 | 120 °C cure | 300 | 83 | 10:1 | 94 ± 2 |
| 3 | 2× thickness | 600 | 58 | 10:1 | 72 ± 21 |
| 4 | 3× thickness | 1000 | 58 | 10:1 | 52 ± 5 |
| 5 | 2× cross-linker | 300 | 58 | 5:1 | 84 ± 6 |
| 6 | 150 °C cure | 300 | 113 | 10:1 | 122 ± 32 (N = 4) |
| 7 | 175 °C cure | 300 | 138 | 10:1 | 116 ± 72 |
| 8 | 150 °C cure, 2× thickness | 600 | 113 | 10:1 | 89 ± 23 |
| 9 | 2× thickness and cross-linker, 120 °C cure | 600 | 83 | 5:1 | 72 (6 mL, N = 1) |
| 10 | 4× cross-linker | 300 | 58 | 2.5:1 | 111 ± 31 |
| 11 | nontransferred array | 300 | 58 | 10:1 | 1722 ± 89 |
Difference between fabrication temperature and experimental temperature (37 °C).
Mean ± standard deviation, N = 3 and liquid load V = 3 mL, unless otherwise noted in parentheses.
The shape of all measured microraft array deflections was highly consistent with model predictions (Figure 3C). For all 25 tested microarrays, the deflection increased by a factor of 2.00 ± 0.18, as the media load doubled from 3 to 6 mL, validating the predicted linear load–deflection relationship in eq S8. Linear changes in microarray deformation were also observed with effective membrane thickness as predicted (Supp. Figure 2A). Furthermore, the magnitude of microraft array deflection was highly consistent with that predicted by the model for arrays made with 10:1 PDMS cured at temperatures below 150 °C (Figure 3D) using experimental and literature parameter values (Supporting Information). For these 12 arrays, the average % absolute difference between the measured and predicted maximal deflection was relatively low: 14 and 15% for 3 and 6 mL loading, or an absolute difference of 15 and 30 μm. For comparison, the estimated uncertainty in a prediction of maximal deformation was 19 and 37 μm for Condition 1 arrays under 3 and 6 mL of liquid loads (Supp. Table 1).
In contrast, microarrays cured at temperatures at or above 150 °C or made from 5:1 PDMS deviated significantly from model predictions (Figure 3E, Supporting Information). The average % absolute difference between measured and predicted deflection for these arrays (Conditions 6–8) was 72 and 74%, or 73 and 151 μm, for 3 and 6 mL of loading, respectively. Transferred microarrays cured at temperatures at 150 or 175 °C showed diminished returns in deflection resistance as temperature increased, which was not predicted by the model (Supp. Figure 2B). One likely explanation is that the PDMS membranes cured at high temperatures began to solidify before reaching the desired cure temperature so that they effectively cured at a lower temperature and stored proportionally less tension. The deformation of PDMS microarrays with increased cross-linker (≤5:1 base/cross-linker) was less than that predicted by the model. Increasing the cross-linker concentration to more than 1 part in 10 is not recommended by the manufacturer, and it has been suggested that at higher cross-linker concentrations, the cross-linker saturates the polymerization sites and forms void spaces within the PDMS, which may cause tensile measurements of material stiffness to underestimate the effective material stiffness.23,24
Overall, the above validations demonstrate that the deformation of transferred microraft arrays was reduced in all cases by increasing the microarray thickness, cure temperature, or cross-linker concentration and that the deformation was accurately predicted for transferred membranes with 10:1 PDMS cured at or below 120 °C. It should be noted that changing the cure temperature of PDMS membranes has been shown to alter the cross-linking density and gas permeability through the material.25 The optimal permeability of PDMS membranes to CH4, N2, and CO2 has been shown to occur at a cure temperature of 75 °C, with greater than 50% decreases in permeability at 150 °C. Nevertheless, for applications that do not require optimal gas transport, increasing the cure temperature of PDMS membranes while adopting a transferred membrane microfabrication method is an accessible way to reduce membrane deflection.
Reductions to Microraft Array Deformation Facilitate Automated Cytometry
To demonstrate the impact of large reductions in membrane deflection on automated image acquisition and analysis under realistic conditions, a deflection-resistant microraft array (Condition 9, Table 1) was seeded with H1299-GFP cells and subsequently imaged along a planar focal surface (Supp. Figure 3). The array exhibited a maximal deflection of 72 μm under the load of 6 mL of culture media. The appearance of images acquired along a planar surface from the deformation-resistant array ranged from focused to visibly defocused, with an average absolute defocusing of 43.5 μm. Quantitative image analysis successfully identified 85.5% of microrafts and exhibited a relative error of −2.7% in quantifying total cell nuclei compared to ground truth. In contrast, a control nontransferred array fabricated without stored tension deflected 1427 μm, resulting in an average absolute defocusing of 400.0 μm when imaged along a flat plane, which allowed only 67.9% of microrafts to be identified. Of the infocus microrafts on the nontransferred array, the total nuclear count was quantified with −62.0% error relative to ground truth. Overall, the transferred membrane fabrication method reduced microraft array deformation by a factor of 19, resulting in a 23-fold improvement in the accuracy of basic cellular cytometry using automated imaging. However, even when paired with a high depth of field objective (4× magnification, NA = 0.13, depth of field (DOF) ≈ 40 μm), neither microarray had deformations small enough for microfeatures or adhered cells to be visualized in focus throughout the entire array along one focal plane.
Rapid Determination of Microarray Imaging Surfaces Using the Physical Model
While the deflection of microraft arrays can be significantly reduced with alterations to the material, geometric, and fabrication parameters, the minimum possible deflection magnitudes (around 50 μm) are still greater than the depth of focus of even the lowest magnification objectives that are useful for image-based cell cytometry. A method capable of imaging along the curved focal plane of microraft arrays would improve the quality of the images. A method was developed based on the physically motivated tension model of deformation to rapidly predict focal positions throughout microraft arrays (Supporting Information). Briefly, a small number of measurements of focal planes were obtained throughout the array. These sparse data were then fit to the mathematical model of microraft deformation using least-squares optimization. Lastly, the fitted model equation was used to predict focal points at any location within the microarray. From in silico testing, diminishing returns on prediction accuracy were observed with increased numbers of focal measurements, and sparse patterns of focal measurements were identified (Supp. Figure 4).
To assess the performance of this focal prediction method, automated microscopy and image analysis were used to acquire and analyze images of a microraft array that was scanned at focal positions predicted using three different focal measurement patterns (Figure 4). The first measurement pattern consisted of 19 points spanning the entire array (“Pattern 1”). The second and third patterns each consisted of a 5 × 5 grid of points concentrated at the center (“Pattern 2”) or edge (“Pattern 3”). There was a 13-fold reduction in the time required to determine the focal positions for imaging of the microraft array using Patterns 1–3, compared to the time taken to run an autofocus routine for each of the 312 images prior to imaging (“ground-truth” method). The median absolute focal differences were 12, 14, and 20 μm when imaging at focuses calculated from Pattern 1, 2, or 3 measurements, respectively, compared to imaging to the ground-truth method. Focus predictions using Pattern 1 measurements were the most precise, with 88 and 99.6% of the focusing errors less than 40 (1× DOF) and 80 μm (2× DOF), respectively (Supp. Figure 5). In all cases, the focal differences were small relative to the array’s maximal deflection of 282 μm.
Figure 4.

Fitting performance using different patterns of focal plane measurement for thermal deformation model prediction of focal planes on a microraft array. (A) Three measurement patterns for shape fitting as well as a 322-point measurement used as ground truth. (B) Three-dimensional visualizations of shape models fit to the data and the ground-truth point clouds of focal measurements. (C) X–Z cross-sectional views of the shape fit (blue curve) though the array center. The black dots on each graph depict the ground-truth focal measurement. (D) Differences, in micrometers, between the ground-truth focal measurements and focal predictions using the thermal-tension model. Dashed line represents 40 μm, 1× depth of field of the microscope objective.
Automated image analysis was used to more quantify the differences in the acquired images (Figure 5). All of the microrafts that could be identified in ground-truth autofocused images could also be identified in images acquired at modeled focal planes based on Patterns 1–3. The median relative differences in individual microraft nuclear and cytoplasmic fluorescence areas between modeled and ground-truth approaches were less than 4% for Patterns 1–3. A summary of the quantitative impact of modeling focal surfaces on cytometric analysis is presented in Table 2. For Pattern 1, the cell count per microraft was accurate for 80% of microrafts, and <5% of microrafts erred by more than 1 when on average there were 6.1 cells per microraft. Overall, accurate imaging cytometry was achieved on the arrays. In contrast, the use of various interpolating splines to predict focal planes did not enable quantitative cytometry of cells on the microraft arrays, with accurate nuclear counts obtained for less than half the microrafts when using Pattern 3 and thin-plate splines (Supp. Figure 6 and Supp. Table 2).
Figure 5.

Application of physical model to automated cytometry. (A) Whole-array stitched bright-field image of a microraft array seeded with H1299-EGFP cells. (B–D) Images from select regions of the array as indicated in panel A. Close-up bright-field (top row) and composite fluorescence (middle row) images of representative individual microrafts are shown at the three locations. Green: cytoplasmic EGFP fluorescence. Blue: nuclear Hoechst 33342 fluorescence. Also shown are visualizations of identified microrafts (white outline), cell cytoplasm (green) and nuclei (blue) (bottom row) after analysis of the bright-field and fluorescence images.
Table 2.
Comparison of Cytometry Performance
| focusing pattern | modeling time (s) | median relative absolute error (%) | microraft analysis efficiency (%) | correct cell counts (%) | incorrecta cell counts (%) | |||
|---|---|---|---|---|---|---|---|---|
|
| ||||||||
| microraft area | cytoplasmic area | nuclear area | cell count | |||||
| ground truth | 1336.4 | 0.0 | 0.0 | 0.0 | 0.0 | 100.0 | 100.0 | 0.0 |
| pattern 1 | 101.3 | 0.5 | 1.1 | 2.0 | 0.0 | 100.7 | 79.7 | 15.7 |
| pattern 2 | 116.0 | 0.8 | 1.7 | 3.0 | 0.0 | 100.8 | 78.0 | 16.3 |
| pattern 3 | 109.0 | 0.9 | 2.2 | 3.4 | 0.0 | 100.4 | 73.2 | 19.8 |
Error of one cell.
CONCLUSIONS
Few options are available to modify membranes to resist deformation—especially in the case of microraft array membranes whose membrane thickness and material strength cannot be substantially modified while maintaining the microarray’s functionality as a cytometry and cell sorting surface. We have demonstrated microfabrication methods to imbue thermal pretension into membranes and that doing so drastically reduces the deflection of microraft arrays. Thermal stress has been reported as problematic for microdevices in the contexts of membrane shrinkage and in warpage of thin electronics.26,27 We instead show that with membrane-transfer microfabrication, thermal membrane stress can be positively harnessed to consistently generate membranes with ≥10-fold more resistance to small loads of cell-culture media. Using the membrane-transfer microfabrication method, we have demonstrated that membrane curing temperature is a novel parameter to linearly reduce deformation of pretensioned membranes. The linearity of our mathematical model facilitated computational fitting of theoretical deformation models to real-world shape data from membranes. The modeling approach was sufficiently accurate in that microscopy images of thermally pretensioned microarrays acquired along the curved focal plane predicted by the model were qualitatively and quantitatively well-focused. The storage of thermally induced tension in PDMS membranes does not impose changes to the membrane design geometry and thus can be readily adopted to membranes within various devices. The combination of (1) our approach to modeling the deformation of microarrays and (2) our microfabrication methods to store tension in membranes is of wide utility and extends to a variety of microdevices, sensors, and MEMS devices utilizing freestanding thin membranes.
Supplementary Material
Acknowledgments
This research was supported by grants from the NIH (EY024556 to N.L.A. and CA206233 to M.D.). The authors thank Dr. Yuli Wang, Dept. Chemistry, University of North Carolina Chapel Hill, for his advice with regards to microraft array microfabrication.
Footnotes
Notes
The authors declare the following competing financial interest(s): N.L.A is an inventor (patent application no.: 20130066031) and has financial interest in Cell Microsystems, Inc.
The Supporting Information is available free of charge on the ACS Publications website at DOI: 10.1021/acs.anal-chem.8b00176.
Mathematical theory for modeling the deformation of microraft arrays; discussions of modeling parameters, modeling uncertainty, modeling limitations, the density of data required for accurate modeling, and the effectiveness of alternate shape models; supplemental methods describe the tensile testing of PDMS, cell culture, and cell staining (PDF)
MATLAB implementations of membrane modeling and automated microscopy imaging (ZIP)
References
- 1.Schneider F, Draheim J, Brunne J, Waibel P, Wallrabe U. SAIEE Africa Res J. 2010;101(1):21–25. [Google Scholar]
- 2.Palchesko RN, Zhang L, Sun Y, Feinberg AW. PLoS One. 2012;7(12):e51499. doi: 10.1371/journal.pone.0051499. [DOI] [PMC free article] [PubMed] [Google Scholar]
- 3.Nour M, Berean K, Griffin MJ, Matthews GI, Bhaskaran M, Sriram S, Kalantar-Zadeh K. Sens Actuators, B. 2012;161(1):982–988. [Google Scholar]
- 4.Ma T, Liang H, Chen G, Poon B, Jiang H, Yu H. Opt Express. 2013;21(10):11994. doi: 10.1364/OE.21.011994. [DOI] [PubMed] [Google Scholar]
- 5.Peterson SL, McDonald A, Gourley PL, Sasaki DY. J Biomed Mater Res. 2005;72A(1):10–18. doi: 10.1002/jbm.a.30166. [DOI] [PubMed] [Google Scholar]
- 6.Chen X, Hou S, Chu J, Xiong Y, Xiong P, Liu G, Tian Y. Micromachines. 2017;8(3):64. [Google Scholar]
- 7.Fan X, Jia C, Yang J, Li G, Mao H, Jin Q, Zhao J. Biosens Bioelectron. 2015;71:380–386. doi: 10.1016/j.bios.2015.04.080. [DOI] [PubMed] [Google Scholar]
- 8.Ma B, Zhou X, Wang G, Dai Z, Qin J, Lin B. Electrophoresis. 2007;28(14):2474–2477. doi: 10.1002/elps.200600619. [DOI] [PubMed] [Google Scholar]
- 9.Charnley M, Textor M, Khademhosseini A, Lutolf M. Integr Biol. 2009;1:625–634. doi: 10.1039/b918172p. [DOI] [PubMed] [Google Scholar]
- 10.Jackman RJ, Duffy DC, Ostuni E, Willmore ND, Whitesides GM. Anal Chem. 1998;70(11):2280–2287. doi: 10.1021/ac971295a. [DOI] [PubMed] [Google Scholar]
- 11.Espinosa HD, Prorok BC, Fischer M. J Mech Phys Solids. 2003;51(1):47–67. [Google Scholar]
- 12.Chrimes AF, Khoshmanesh K, Stoddart PR, Mitchell A, Kalantarzadeh K. Chem Soc Rev. 2013;42(13):5880. doi: 10.1039/c3cs35515b. [DOI] [PubMed] [Google Scholar]
- 13.Gach PC, Wang Y, Phillips C, Sims CE, Allbritton NL. Biomicrofluidics. 2011;5(3):032002. doi: 10.1063/1.3608133. [DOI] [PMC free article] [PubMed] [Google Scholar]
- 14.Wang Y, Phillips C, Xu W, Pai JH, Dhopeshwarkar R, Sims CE, Allbritton NL. Lab Chip. 2010;10(21):2917–2924. doi: 10.1039/c0lc00186d. [DOI] [PMC free article] [PubMed] [Google Scholar]
- 15.Attayek PJ, Hunsucker SA, Wang Y, Sims CE, Armistead PM, Allbritton NL. Anal Chem. 2015;87(24):12281. doi: 10.1021/acs.analchem.5b03579. [DOI] [PMC free article] [PubMed] [Google Scholar]
- 16.Welch JD, Williams LA, DiSalvo M, Brandt AT, Marayati R, Sims CE, Allbritton NL, Prins JF, Yeh JJ, Jones CD. Nucleic Acids Res. 2016;44(17):8292–8301. doi: 10.1093/nar/gkw700. [DOI] [PMC free article] [PubMed] [Google Scholar]
- 17.Attayek PJ, Hunsucker SA, Sims CE, Allbritton NL, Armistead PM. Integr Biol (Camb) 2016;8(12):1208–1220. doi: 10.1039/c6ib00168h. [DOI] [PMC free article] [PubMed] [Google Scholar]
- 18.Gracz AD, Williamson IA, Roche KC, Johnston MJ, Wang F, Wang Y, Attayek PJ, Balowski J, Liu XF, Laurenza RJ, Gaynor LT, Sims CE, Galanko JA, Li L, Allbritton NL, Magness ST. Nat Cell Biol. 2015;17(3):340–349. doi: 10.1038/ncb3104. [DOI] [PMC free article] [PubMed] [Google Scholar]
- 19.Wang Y, Phillips CN, Herrera GS, Sims CE, Yeh JJ, Allbritton NL. RSC Adv. 2013;3:9264–9272. doi: 10.1039/C3RA41764F. [DOI] [PMC free article] [PubMed] [Google Scholar]
- 20.Krotkov E. Int J Comput Vis. 1988;1(3):223–237. [Google Scholar]
- 21.Brent RP. Algorithms for minimization without derivatives. Prentice-Hall; Englewood Cliffs, New Jersey, U.S.A: 1972. [Google Scholar]
- 22.Xu W, Luikart AM, Sims CE, Allbritton NL. Anal Bioanal Chem. 2010;397(8):3377–3385. doi: 10.1007/s00216-010-3728-2. [DOI] [PMC free article] [PubMed] [Google Scholar]
- 23.Mata A, Fleischman AJ, Roy S. Biomed Microdevices. 2005;7:281–293. doi: 10.1007/s10544-005-6070-2. [DOI] [PubMed] [Google Scholar]
- 24.Winter HH, Chambon F. J Rheol (Melville, NY, U S) 1986;30(2):367–382. [Google Scholar]
- 25.Berean K, Ou JZ, Nour M, Latham K, McSweeney C, Paull D, Halim A, Kentish S, Doherty CM, Hill AJ, Kalantarzadeh K. Sep Purif Technol. 2014;122:96–104. [Google Scholar]
- 26.Lee SW, Lee SS. Microsyst Technol. 2008;14(2):205–208. [Google Scholar]
- 27.Kim C, Lee TI, Kim MS, Kim TS. Microelectron Reliab. 2017;73:136–145. [Google Scholar]
Associated Data
This section collects any data citations, data availability statements, or supplementary materials included in this article.