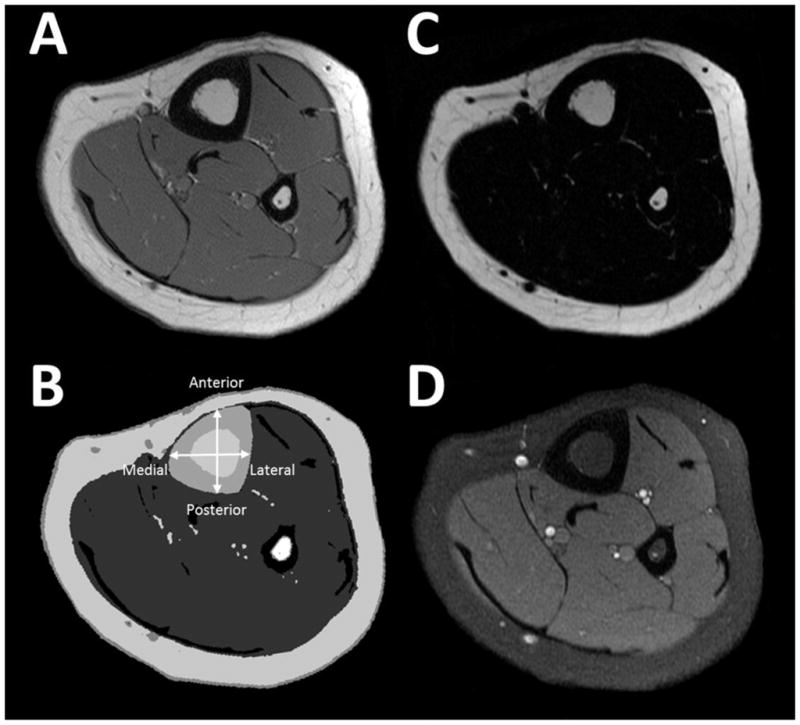
Figure 1.

A general description of the image processing procedure used to quantify bone architecture and strength of the midtibia and the fat infiltration of the bone marrow and surrounding musculature. Raw T1-weighted magnetic resonance images (A) were segmented (B) into tibia cortical bone (large black ring; fibula is the small black ring) and bone marrow (white region surrounded by the cortical bone), muscle (gray region surrounding the bone) and adipose tissue (AT; white ring surrounding the muscles and bones and the white voxels interspersed among the musculature). The bone, muscle and AT volumes, bone widths (cortical bone in the anterior, posterior, medial and lateral portions and the bone marrow and total bone in the anterior-posterior and medial-lateral directions) and estimates of bone strength (section modulus in the anterior-posterior and medial-lateral directions and polar moment of inertia) were calculated. Voxels identified as bone marrow and muscle were applied to fat (C) and water (D) images to determine bone marrow and intramuscular fat concentration [25].
