Abstract
Background
To investigate the performance of the MSKCC salivary carcinoma nomograms predicting overall survival, cancer-specific survival and recurrence with an external validation dataset.
Methods
The validation dataset comprised 123 patients treated between 2010 and 2015 at our institution. They were evaluated by assessing discrimination (concordance-index) and calibration (plotting predicted versus actual probabilities for quintiles).
Results
The validation cohort (n=123) showed some differences to the original cohort (n=301). The validation cohort had less high-grade cancers (p=0.006), less lymphovascular invasion (p<0.001) and shorter follow up of 19 months versus 45.6 months. Validation showed a concordance-index of 0.833 (95%CI 0.758, 0.908), 0.807 (95%CI 0.717, 0.898) and 0.844 (95%CI 0.768, 0.920) for overall survival, cancer specific survival and recurrence, respectively.
Conclusion
The 3 salivary gland nomograms performed well using a contemporary validation dataset, despite limitations related to sample size, follow-up and differences in clinical and pathology characteristics between the original and validation cohorts.
Keywords: Salivary Cancer, Nomogram, Prediction, Survival, Recurrence
Introduction
Primary malignancies of the major salivary glands are rare and diverse cancers (1). They account for 3–6% of all head and neck malignancies (2). The commonest sites are the parotid gland, followed by the submandibular gland and then the sublingual gland (2). The AJCC staging systems is designed for the prediction of prognosis and outcomes in populations of patients (3). These do not necessarily predict well for individuals. Predicting prognosis and behavior in this disease is difficult because of the heterogeneity in histological types and with factors such as peri-neural invasion, lymphovascular invasion, grade and margin status not being taken into account in the AJCC staging system (1). Salivary malignancies affect all age groups from pediatric to the elderly. These factors are also not accounted for in the AJCC staging system. With so many potential variables, making individual prediction and treatment choices is difficult for the patient and treating physician.
Therefore, the use of nomograms may be useful in the treatment of malignancies of major salivary glands. Nomograms are statistical tools that predict clinical outcomes for an individual based on a number of variables, commonly patient and histopathological factors (4). They are typically created using regression analysis and are a graphical description of a complex predictive model (5). They have been reported to outperform experienced clinicians in some settings (6) and have been used in clinical trial inclusion criteria and in the National Comprehensive Cancer Network (NCCN) guidelines (7). They may also be included in the new AJCC staging systems for some cancer types (8). The steps involved in building a nomogram include defining the population, specifying the outcome of interest and then identifying potential factors which influence the outcome. After building the nomogram using regression analysis, the model is then validated. This can be done with internal validation using bootstrapping or by using an external dataset (9).
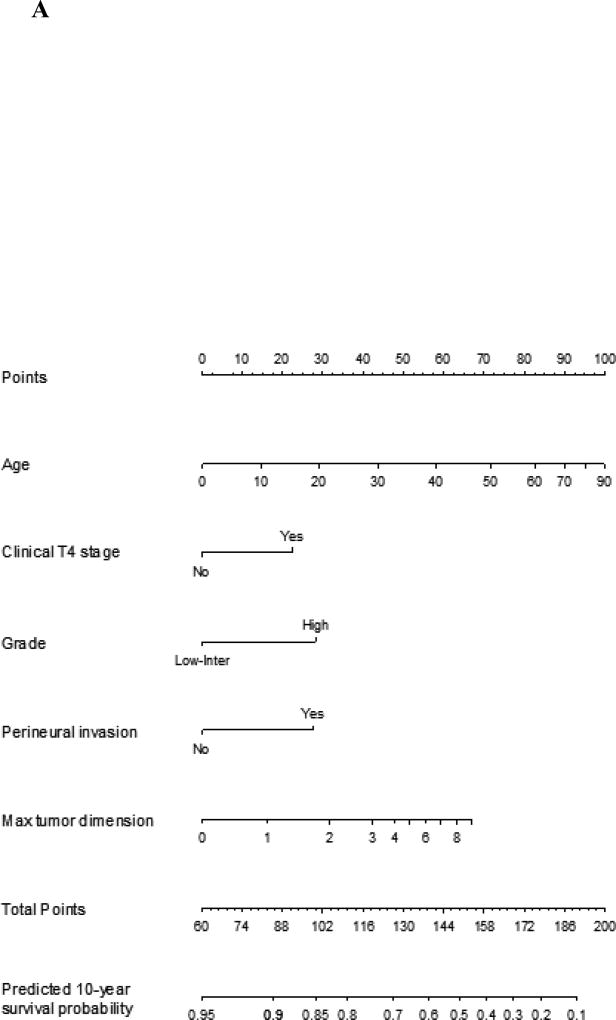
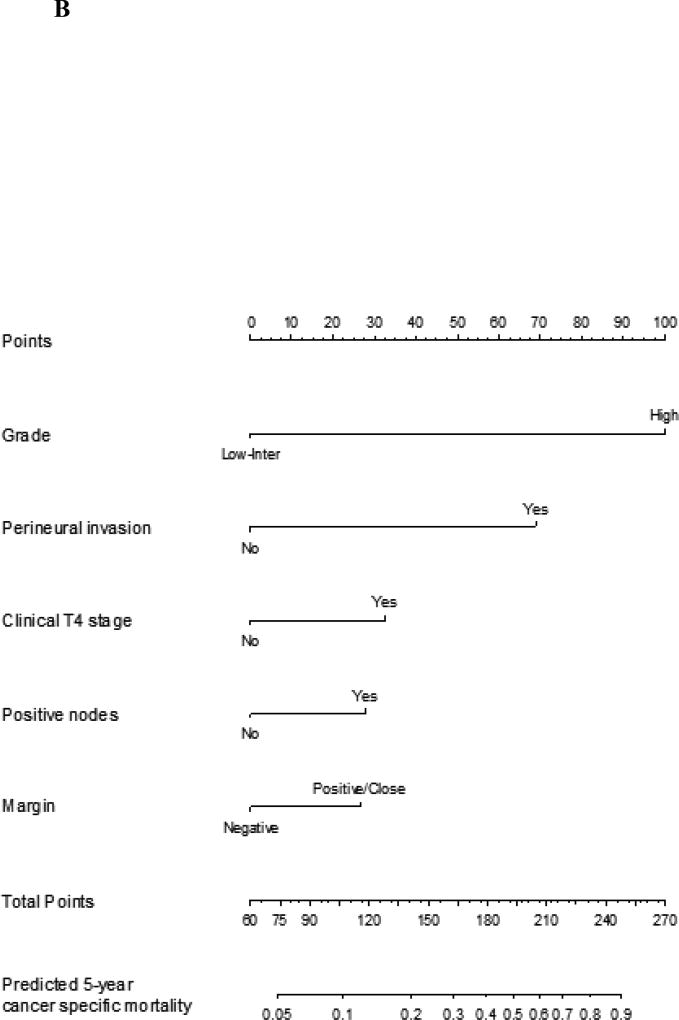
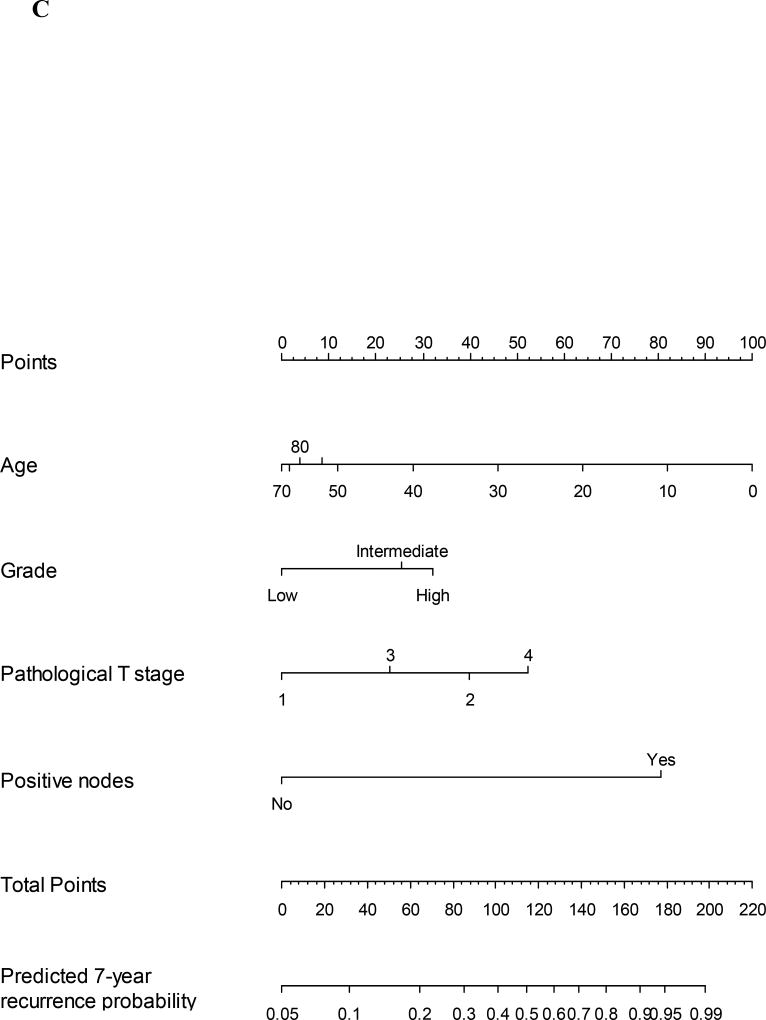
Major salivary gland nomograms for overall survival (10), cancer specific survival (10) and recurrence (11) have recently been published by our institution. A comprehensive list of potential factors, created in consultation with an expert panel and consultation with the literature, were considered as potential covariates and used to collect initial data for the nomogram generation cohort. These were then examined with univariate analysis to identify potential covariates. The most predictive factors were combined into multiple variable combinations and then assessed. Factors with the highest predictive value based on a step-down model reduction method were parsimoniously selected, limited by the number of events. The nomogram for overall survival used age, maximum tumor dimension and clinical T4 classification, grade and perineural invasion as covariates. The nomogram for cancer-specific survival used grade, perineural invasion, clinical T4 classification, positive nodes and margin status. The nomogram for recurrence used age, grade, vascular invasion and presence of positive lymph nodes.
To test the performance of these nomograms internal validation was done using bootstrapping. In bootstrapping, random samples are drawn from the original dataset to create a test dataset, and this is repeated making a larger number of test datasets or indices. An average is taken of the model’s performance in all the indices and compared to the original. The performance of the model is always best on the original dataset and the difference between the two is an estimate of the over fit and provides an assessment of how the model might perform in the future. However, the gold standard validation of a nomogram model is the evaluation of its performance on an external dataset, a dataset that was not used in constructing the model. This provides the best evidence for the external applicability of the model and is critical in the application of these models to other patient populations. The aim of our study was describe the validation of these nomograms using an external dataset of patients from a contemporary cohort of patients. This will provide evidence for the generalizability of nomograms and provide support for the clinical application of these nomograms.
Method
Approval was granted from the Memorial Sloan Kettering Cancer Center (MSKCC) Institutional Review Board (IRB) to perform this study. Patients included in the initial nomogram studies (nomogram development) had primary treatment at our institution with surgery and adjuvant treatment if indicated. Indications for postoperative radiotherapy were patients with pathological T3/4 classification tumors, positive neck disease, peri-neural and vascular invasion, positive margins, and high grade tumors (10). Patients who had prior open biopsy (incisional or excisional), had recurrent tumors, prior surgery or prior radiotherapy were excluded. This cohort included patients treated between 1985 through 2009.
In our previous studies the nomograms of recurrence, overall survival and cancer specific survival were generated by assessing predictive factors using univariate analysis. The most predictive factors were combined into multiple variable combinations and then assessed. Factors with the highest predictive value based on a stepdown model reduction method were parsimoniously selected, limited by the number of events. Clinical knowledge and known clinically important factors were used to decide which covariates were included in the final model. The nomogram for overall survival was validated by using the internal validation technique of bootstrapping. The concordance index score was 0.809 (95% CI 0.772, 0.849). The same techniques were used for cancer specific survival and recurrence nomograms. The concordance index for these nomograms were 0.856 (95% CI 0.852, 0.866) and 0.850 (95% CI 0.813, 0.888), respectively. The graphical representation can be seen in Figure 1A–C.
Figure 1.
A Nomogram for prediction of 10-year overall survival probability for major salivary gland malignancy. The corresponding points for each variable is determined and then the sum of these is plotted on the total points bar. 10-year overall survival probability is then determined by tracing down from the total points score
B Nomogram for prediction of 5-year cancer specific mortality for major salivary gland malignancy. The corresponding points for each variable is determined and then the sum of these is plotted on the total points bar. 5-year cancer specific mortality probability is then determined by tracing down from the total points score
C Nomogram for prediction of 7-year recurrence probability for major salivary gland malignancy. The corresponding points for each variable is determined and then the sum of these is plotted on the total points bar. 7-year recurrence probability is then determined by tracing down from the total points score
In the current study the same inclusion and exclusion criteria were used to generate the external validation dataset. This included patients treated between 2010 thorough 2015. A validation dataset should be similar in terms of cancer types and patient demographics but different in terms of another important factor such as historical time or geographic location (9). A more recent cohort of patients whose data had not been used in the original nomogram generation was used. In both cohorts, a retrospective analysis of the patient record was used to extract demographic, clinical, tumor, treatment and outcome data. Data were stored in Caisis (Biodigital), an oncological open source data software on a secure institutional network.
Details of variables in nomogram
Clinical factors collected included age, gender, clinical N and T classification. Pathological factors collected included histology, tumor grade, margin status, vascular invasion, perineural invasion, and pathological T and N classification. Tumors were graded as either high grade or intermediate/low grade. Tumors were designated high grade based on their histological type in some cases, such as adenocarcinoma, anaplastic, carcinoma ex pleomorphic adenoma, poorly differentiated carcinoma and salivary duct carcinoma. In tumors such as adenoid cystic carcinoma, mucoepidermoid carcinoma and myoepithelial carcinoma, accepted histological convention was used to classify these as high or low/intermediate grade tumors (2). Lymphovascular invasion (LVI) was defined as the presence of malignant cells in lymphatic or vascular vessels on histological examination. Perineural invasion (PNI) was defined as tumor cells invading and spreading around the space surrounding nerves (12).
Definitions of outcomes
Overall survival was calculated from the day of operation to the last known follow up date or date of death found in the hospital records or social security index. Cancer specific survival was calculated from the day of surgery until last known follow up or death from salivary cancer reported in the patient record. Recurrence was calculated from the day of surgery until the first local, regional or distant recurrence reported in the patient record.
Statistical analysis
Nomograms for overall survival, cancer specific survival and recurrence have previously been reported (10, 11) for the salivary gland carcinoma nomogram-generation cohort (original cohort) and are presented in Figure 1A–C.
Comparison of the original cohort with the validation cohort was performed, comparing patient demographics and clino-pathological factors. The Chi squared test of association or Fisher’s exact test were used for the comparison of categorical variables and the Wilcoxon rank test for continuous variables.
Nomogram validation was assessed by plotting a calibration curve and measuring the discrimination of nomograms with the concordance index (C-index). The calibration curve is generated by plotting the predicted probability against actual probability of the outcome. Discrimination of a model is the ability of the model to separate patients with different outcomes. The value of the C-index varies between 0.5–1.0, with 0.5 indicating random chance and 1.0 indicating perfect ability to discriminate.
Results
Clinical characteristics
The external validation cohort consisted of 123 patients with a median age of 60. Male patients accounted for 52% of the nomogram generation cohort and 48% of the validation dataset. There were no significant differences in age, gender, clinical T classification or clinical N classification between the cohorts
T2 tumors were the most common tumor T classification in both cohorts, accounting for 43% in the generation cohort and 42% in validation cohort. The proportion of patients with clinical T4 tumors was 11% in the original cohort and 10% in the validation cohort. The majority of patients had clinically negative neck lymph node status, 88% in the nomogram generation cohort and 80% in the validation cohort (Table 1).
Table 1.
Table of clinical factors in the nomogram generating cohort and validation cohort. (N/A – too few cases in some groups for analysis)
| Factor | Original Cohort N=301 |
% | Validation Cohort N=123 |
% | p | |
|---|---|---|---|---|---|---|
|
| ||||||
| Age (years) | Median (Q1, Q3) | 62 (50, 71) | 60 (47.5, 70) | .489 | ||
|
| ||||||
| Sex | Male | 156 | 52 | 59 | 48 | .471 |
| Female | 145 | 48 | 64 | 52 | ||
|
| ||||||
| T Stage | cT1/Tx | 76 | 25 | 47 | 38 | .263 |
| cT2 | 129 | 43 | 52 | 42 | ||
| cT3 | 64 | 21 | 10 | 8 | ||
| cT4 | 32 | 11 | 12 | 10 | ||
| NK* | 2 | 2 | ||||
|
| ||||||
| N stage | N0 | 264 | 88 | 99 | 80 | N/A |
| N1 | 13 | 4 | 5 | 4 | ||
| N2 | 24 | 8 | 18 | 15 | ||
| N3 | 0 | 0 | 1 | 1 | ||
|
| ||||||
| Follow up (Months) | Median (Q1,Q3) | 45.6 (20, 98) | 19 (10, 33) | <0.001 | ||
NK = not known. These patients were not included in statistical test
Tumor characteristics
Mucoepidermoid carcinoma was the most common histology type in both cohorts, accounting for 31% of patients in the original cohort and 25% in the validation cohort. There was a larger proportion of carcinoma ex pleomorphic adenoma in the original cohort (19.6%) compared to the validation cohort (5.7%). However, the validation cohort had a larger proportion of adenoid cystic carcinoma, myoepitheilial carcinoma and salivary duct carcinoma (Figure 2).
Figure 2.
Graph showing the percentage of different histology types in the original and validation cohorts. (PLGA Polymorphous low grade adenocarcinoma)
The original cohort had less low/intermediate-grade cancers (34.6% versus 64.2%, p=0.006). There was less lymphovascular invasion in the validation cohort (14.7% versus 22.2%, p<0.001) and the mean max size was smaller (2.2cm versus 2.5cm, p=0.004). There were no significant differences in the proportions of patients with peri-neural invasion, surgical positive margins, and presence of pathological cervical lymph node metastases (Table 2).
Table 2.
Table of clinico-pathological factors used in the nomogram models in the nomogram generating cohort and validation cohort.
| Variable | Original Cohort |
% | Validation Cohort |
% | P value (χ2 test) |
|
|---|---|---|---|---|---|---|
|
| ||||||
| Grade | Low/Intermediate | 104 | 34.6 | 79 | 64.2 | .006 |
| High | 110 | 36.5 | 44 | 35.8 | ||
| NK* | 87 | 28.9 | ||||
|
| ||||||
| LVI | Yes | 67 | 22.2 | 18 | 14.7 | .000 |
| No | 129 | 42.9 | 103 | 83.7 | ||
| NK* | 105 | 34.9 | 2 | 1.6 | ||
|
| ||||||
| PNI | Yes | 99 | 32.9 | 51 | 41.5 | .272 |
| No | 107 | 35.5 | 71 | 57.7 | ||
| NK* | 95 | 31.6 | 1 | 0.8 | ||
|
| ||||||
| Margin | Negative | 113 | 37.5 | 48 | 39.0 | .753 |
| Positive/close | 158 | 52.5 | 72 | 58.5 | ||
| NK* | 30 | 10.0 | 3 | 2.5 | ||
|
| ||||||
| Positive nodes | Yes | 72 | 23.9 | 24 | 19.5 | .268 |
| No | 217 | 72.1 | 97 | 78.9 | ||
| NK* | 12 | 4.0 | 2 | 1.6 | ||
|
| ||||||
| Max tumor size | Mean | 2.5 | 2.2 | .004 | ||
| Range (Min, Max) | (1.5, 3.5) | (1.5, 3.2) | ||||
|
| ||||||
| Clinical T4 | Yes | 32 | 10.6 | 12 | 9.8 | .789 |
| No | 269 | 89.4 | 111 | 90.2 | ||
LVI-Lymphovascular invasion, PNI-Perineural invasion.
NK = not known. These patients were not included in statistical test
Outcomes
The median follow up of survivors in the original cohort was 45.6 months and 19 months in the validation cohort (p<0.001). There were 117 deaths, 70 recurrences and 58 cancer-specific deaths in the original cohort. In the validation cohort, there were 24 deaths, 19 recurrences, and 18 cancer-specific deaths.
Nomogram validation
The concordance indices with 95% confidence intervals (CI) for the original cohort were 0.809 (0.772, 0.849) for overall survival, 0.856 (0.852, 0.866) for cancer specific survival and 0.850 (0.813, 0.888) for recurrence.
Validation of the nomograms using the external dataset showed the concordance-index for overall survival with 95% confidence intervals (CI) to be 0.833 (0.758, 0.908). Cancer specific survival had a concordance-index of 0.897 (0.717, 0.898) and recurrence concordance-index was 0.844 (0.768, 0.920).
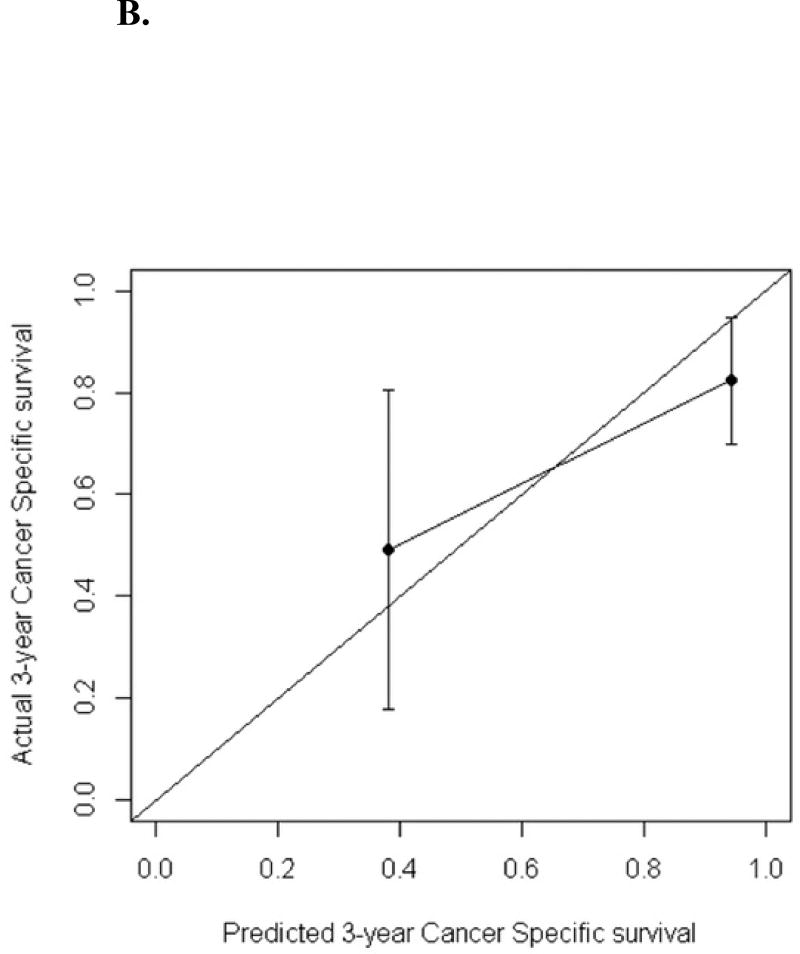
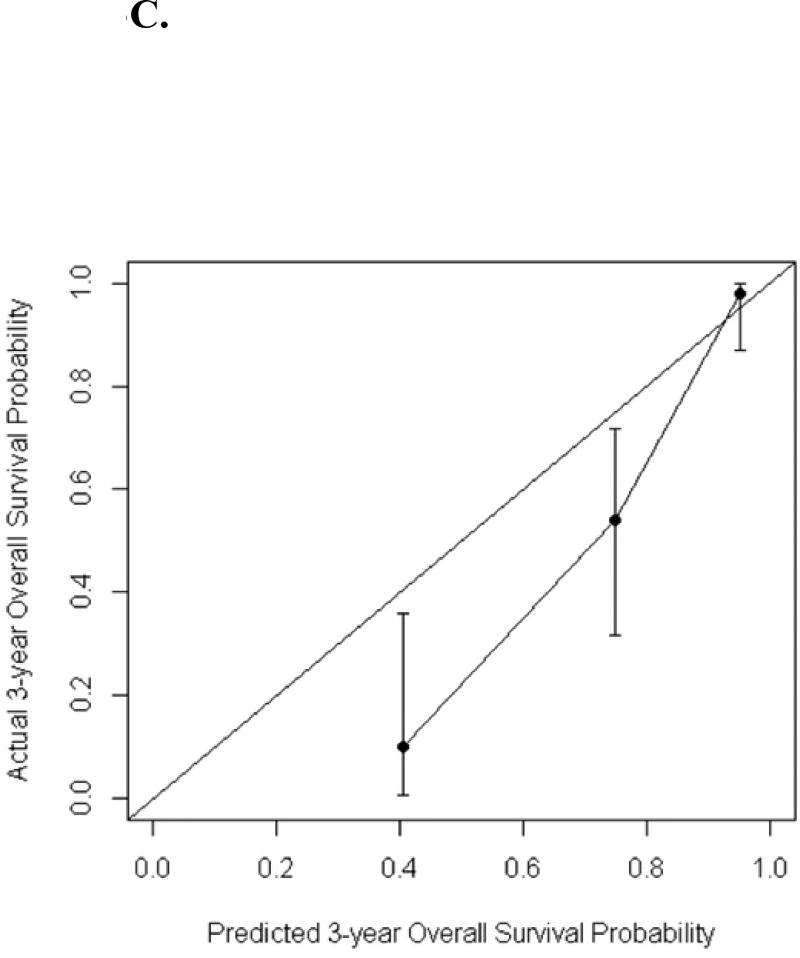
The calibration curves for predicted 3-year recurrence free probability, cancer specific survival and overall survival can be seen in Figures 3A–C. The calibration plots were generated by grouping patients into several groups, in which the average predicted 3-year overall survival/cancer specific survival/recurrence free probabilities were able to be compared with the actual event survival rate. The number of groups selected is arbitrary depending on the cohort size but by convention, 4 groups are usually chosen to do the comparison. In this study the number of events are small, to ensure there were at least one event within each group, 3 groups were used for overall survival and recurrence; while 2 groups were used for cancer specific survival as the number of cancer specific death was the smallest. The dots in the calibration plots showed the average predicted probabilities, and the vertical bars were the corresponding 95% confidence intervals
Figure 3.
A. Calibration plot for the validation cohort: recurrence-free probability at 3 years
B. Calibration plot for the validation cohort: cancer-specific survival probability at 3 years
C. Calibration plot for the validation cohort: overall survival probability at 3 years
Discussion
Salivary gland carcinomas are a particularly heterogeneous group of tumors. This makes estimating survival and recurrence challenging. Staging systems have been used in the past, but these can be imprecise for an individual. Therefore, the MSKCC nomograms for overall survival, cancer specific survival and recurrence were created. The aim of this study was to validate these nomograms on an external dataset.
The concordance index for the validation cohort for overall survival, cancer specific survival and recurrence nomograms were all over 0.8 suggesting they all performed well. Differences in the concordance index is influenced by differences in cohort populations, the variation in the covariates and the follow up length. A larger difference in underlying population characteristics and covariates can cause a decrease in the concordance score. There were some differences between the cohorts on univariate analysis which included the proportion of high grade tumors and the presence of LVI. There were also some differences in the proportion of histological diagnoses between cohorts. Such differences could have resulted in a lower estimation of the concordance indexes. Shorter follow up tends to increase a concordance score. In our validation cohort, there was a significantly shorter follow up time and therefore this may have improved the concordance scores. Despite these differences, the nomograms performed well indicating their potential for generalizability to other populations.
The MSKCC salivary malignancy nomograms are the first to be published and externally validated in the literature giving the potential to provide personalized, tailored information to patients. The alternative approach to prognostication involves using staging systems in which patients are grouped based on just clinical variables or on a clinically generated score. Examples of these for predicting recurrence are the AJCC staging system (3), Carrillo score (13) and Vander Poorten score (14). These 3 prognostic scoring systems have been tested on an external dataset of parotid cancers from an Asian institution (15). They were reported to perform well, with a c-statistic for predicting 5-year recurrence free survival of 0.74 (Standard Error (SE), 0.04) for the AJCC staging, 0.74 (SE, 0.04) for the Vander Poorten score, and 0.62 (SE, 0.04) for the Carrillo score. The MSKCC 3 year recurrence nomogram c-statistic result was 0.844 (CI 0.768, 0.920). The main advantage of the nomogram approach is the ability to give personalised information for an individual and in the future they may also have a role in selecting treatments and adjuvant therapies.
Our study does have a number of limitations. Both the original cohort nomograms and the validation analysis are all based on retrospective data collection from the same institution. The data is therefore susceptible to the risk of selection bias and by the bias introduced from single institution data. Further validation on a geographically different cohort could strengthen the evidence for the nomograms. The validation cohort is based on a recent group of patients and therefore has a shorter follow up period. Therefore, the validation probabilities for calibration were based on 3 year probabilities. This may be a potential source of bias because with a shorter follow up time there will be fewer events such as death and recurrences. This can affect the accuracy and size of the confidence intervals, as in this study leading to wider confidence intervals. The calibration plots compare the predicted survival probability with the actual event survival rate within each group. The calibration plot is sensitive to the number of groups selected. In our study, due to the small number of events especially for cancer specific survival, the patients were not evenly distributed into 4 groups as usual because using 4 groups would result in no events in some groups making it difficult to draw the calibration curve. Hence the number of groups and number of patients in each group have been adjusted in order to successfully generate the calibration curve. The difference in the width of the confidence bars reflected the difference in the number of patients in each of the groups. As a result, the overall survival nomogram over predicted the 3-year overall survival probabilities especially for the two groups of patients with the low survival probabilities.
Nomogram use in clinical practice is a useful tool and adjunct in discussions with patients. However, they are currently not used routinely in making treatment decisions or choosing adjuvant therapy. This study shows that our salivary nomogram can be successfully validated on an external dataset suggesting a wider applicability. However, further validation on external datasets from different countries is required.
Acknowledgments
Ashley Hay received a travel fellowship grant from The Countess Eleanor Peel Dowager fund to undertake overseas study for a period of one year. This research was funded in part through the NIH/NCI Cancer Center Support Grant P30 CA008748.
Footnotes
Presented at American Head and Neck academy meeting, Seattle, July 2016 as oral presentation
No conflicts of interest
References
- 1.Lewis AG, Tong T, Maghami E. Diagnosis and Management of Malignant Salivary Gland Tumors of the Parotid Gland. Otolaryngol Clin North Am. 2016;49(2):343–80. doi: 10.1016/j.otc.2015.11.001. [DOI] [PubMed] [Google Scholar]
- 2.Barnes L, Chiosea SI, Seethala RR. Head and neck pathology. New York: Demos Medical Publishing; 2011. xi, 199 p. : col. ill. ; 29 cm. p. [Google Scholar]
- 3.Edge SB, American Joint Committee on C, American Cancer S . AJCC cancer staging handbook : from the AJCC cancer staging manual. 7. New York: Springer; 2010. xix, 718 p. : ill. (some col.) ; 21 cm. p. [Google Scholar]
- 4.Balachandran VP, Gonen M, Smith JJ, DeMatteo RP. Nomograms in oncology: more than meets the eye. Lancet Oncol. 2015;16(4):e173–80. doi: 10.1016/S1470-2045(14)71116-7. [DOI] [PMC free article] [PubMed] [Google Scholar]
- 5.Kattan MW, Marasco J. What is a real nomogram? Semin Oncol. 2010;37(1):23–6. doi: 10.1053/j.seminoncol.2009.12.003. [DOI] [PubMed] [Google Scholar]
- 6.Kattan MW. Nomograms are superior to staging and risk grouping systems for identifying high-risk patients: preoperative application in prostate cancer. Curr Opin Urol. 2003;13(2):111–6. doi: 10.1097/00042307-200303000-00005. [DOI] [PubMed] [Google Scholar]
- 7.Deborah Freeman Cass DS, editor. NCCN. NCCN Clinical Practice Guidelines in Oncology Prostate Cancer. 2016. [Google Scholar]
- 8.Pan JJ, Ng WT, Zong JF, Lee SW, Choi HC, Chan LL, et al. Prognostic nomogram for refining the prognostication of the proposed 8th edition of the AJCC/UICC staging system for nasopharyngeal cancer in the era of intensity-modulated radiotherapy. Cancer. 2016;122(21):3307–15. doi: 10.1002/cncr.30198. [DOI] [PMC free article] [PubMed] [Google Scholar]
- 9.Iasonos A, Schrag D, Raj GV, Panageas KS. How To Build and Interpret a Nomogram for Cancer Prognosis. Journal of Clinical Oncology. 2008;26(8):1364–70. doi: 10.1200/JCO.2007.12.9791. [DOI] [PubMed] [Google Scholar]
- 10.Ali S, Palmer FL, Yu C, DiLorenzo M, Shah JP, Kattan MW, et al. Postoperative nomograms predictive of survival after surgical management of malignant tumors of the major salivary glands. Ann Surg Oncol. 2014;21(2):637–42. doi: 10.1245/s10434-013-3321-y. [DOI] [PubMed] [Google Scholar]
- 11.Ali S, Palmer FL, Yu C, DiLorenzo M, Shah JP, Kattan MW, et al. A predictive nomogram for recurrence of carcinoma of the major salivary glands. JAMA Otolaryngol Head Neck Surg. 2013;139(7):698–705. doi: 10.1001/jamaoto.2013.3347. [DOI] [PubMed] [Google Scholar]
- 12.Batsakis JG. Nerves and neurotropic carcinomas. Ann Otol Rhinol Laryngol. 1985;94(4 Pt 1):426–7. [PubMed] [Google Scholar]
- 13.Carrillo JF, Vazquez R, Ramirez-Ortega MC, Cano A, Ochoa-Carrillo FJ, Onate-Ocana LF. Multivariate prediction of the probability of recurrence in patients with carcinoma of the parotid gland. Cancer. 2007;109(10):2043–51. doi: 10.1002/cncr.22647. [DOI] [PubMed] [Google Scholar]
- 14.Vander Poorten VL, Balm AJ, Hilgers FJ, Tan IB, Loftus-Coll BM, Keus RB, et al. The development of a prognostic score for patients with parotid carcinoma. Cancer. 1999;85(9):2057–67. [PubMed] [Google Scholar]
- 15.Lu CH, Liu CT, Chang PH, Yeh KY, Hung CY, Li SH, et al. Validation and Comparison of the 7th Edition of the American Joint Committee on Cancer Staging System and Other Prognostic Models to Predict Relapse-Free Survival in Asian Patients with Parotid Cancer. J Cancer. 2016;7(13):1833–41. doi: 10.7150/jca.15692. [DOI] [PMC free article] [PubMed] [Google Scholar]


