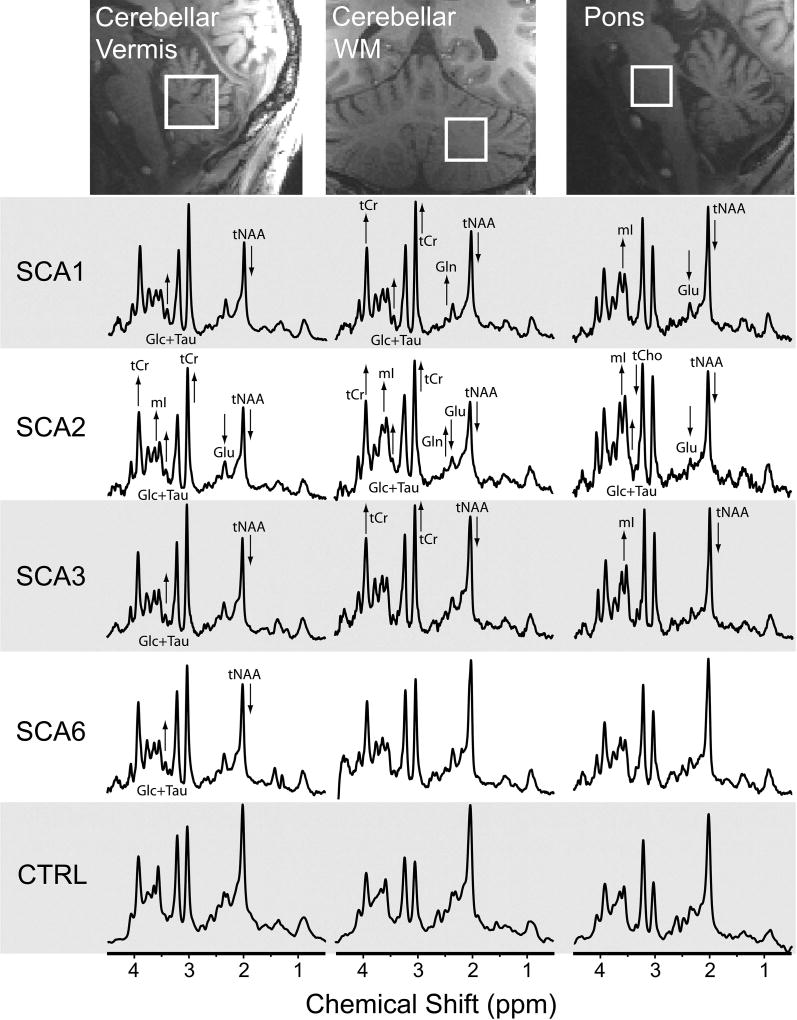
Fig. 2. Detection of neurochemical abnormalities in MR spectra obtained from individuals with SCA at premanifest stage vs. healthy controls.
MRS voxel locations and spectra (semi-LASER, TE=26 ms, TR=5 s, 64 transients) are shown from a single subject in each group; subjects with SCAs were at the premanifest stage (SARA ≤ 2.5). Arrows indicate type I error corrected significant group metabolite differences in each early SCA group compared to controls. [Abbreviations: Glc, glucose; Gln, glutamine; Glu, glutamate; mI, myo-inositol; tCho, total choline; tCr, total creatine; tNAA, total N-acetylaspartate; Tau, taurine].

