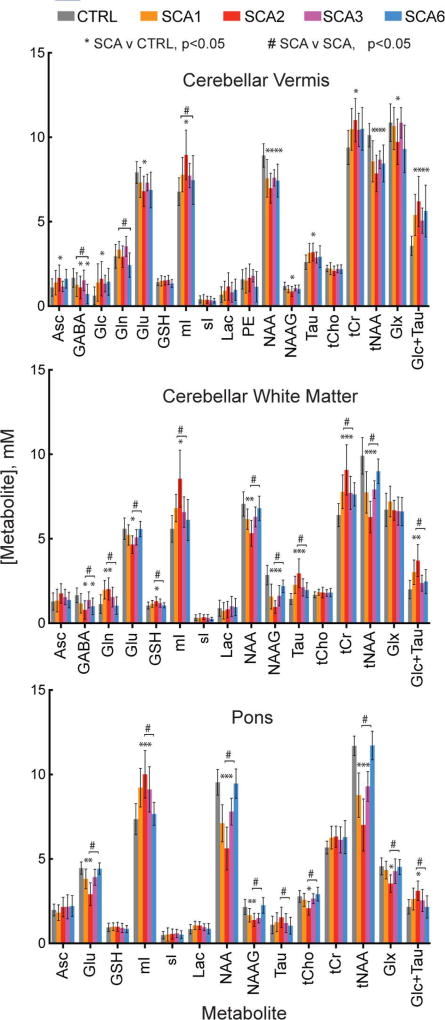
Fig. 3. Regional neurochemical profiles.
Neurochemical profiles from each of the subject groups for each of the VOIs. Error bars indicate standard deviation. Only metabolites with mean Cramér-Rao lower bounds (CRLB) ≤20% in at least one group are included in the profiles. Significant differences (p<0.05, type I error corrected) between SCA and control (*) and between any two SCA types (#) are marked. Sample sizes are listed in Fig. 1 and group differences, confidence intervals, and p-values for all metabolite comparisons are provided in Table S1. [Abbreviations: Asc, ascorbate; GABA, γ-aminobutyric acid; Glc, glucose; Gln, glutamine; Glu, glutamate; GSH, glutathione; mI, myo-inositol; sI, scyllo-inositol; Lac, lactate; NAA, N-acetylaspartate; NAAG, N-acetylaspartylglutamate; PE, phosphorylethanolamine; Tau, taurine; tCho, total choline; tCr, total creatine; tNAA, NAA+NAAG; Glx, Gln+Glu].

