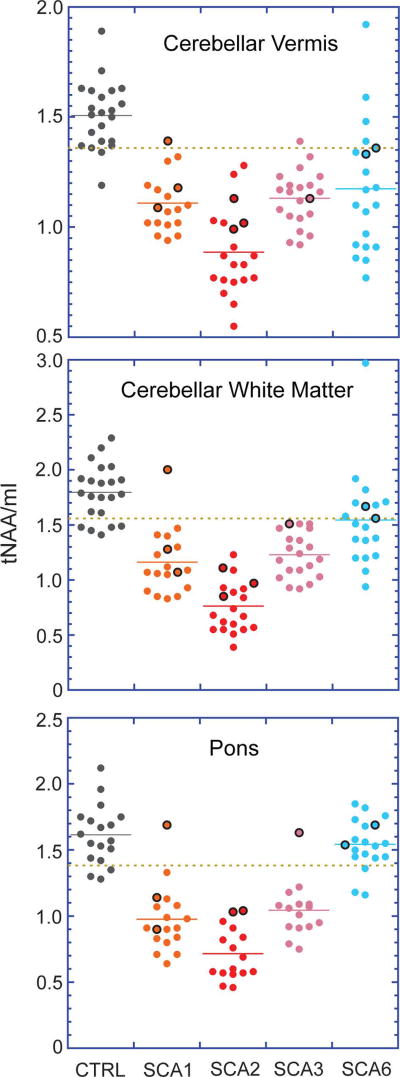
Fig. 4. Total N acetylaspartate-to-myo-inositol ratios (tNAA/mI) for all subjects.
Data from premanifest subjects (SARA ≤ 2.5) are denoted as points encircled with black. The dashed copper line indicates the mean minus one SD for the control group in each plot. One premanifest SCA1 and two premanifest SCA6 subjects who are within the control mean ± SD range in all plots are those subjects with estimated ataxia onset more than 10 years away. One of the premanifest SCA2 subjects lacked data from the pons, hence the loss of a data point in the pons plots.

