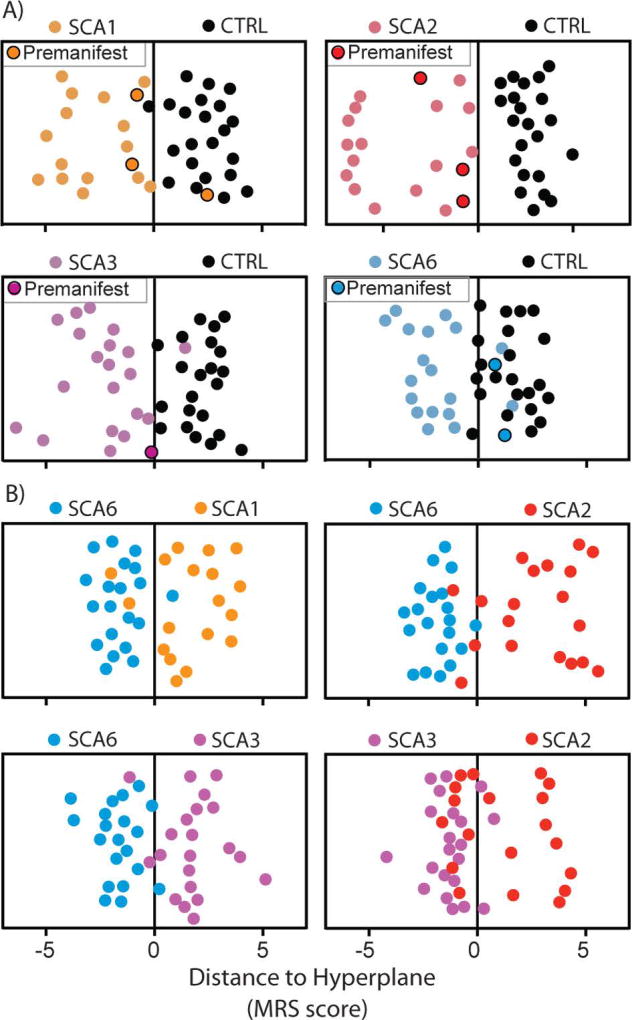
Fig. 5. SCA classification based on distance-weighted discrimination.
Distance-weighted discrimination jitter plots of MRS scores from binary group comparisons between A) SCA vs healthy controls and B) SCA vs SCA. Data points with black borders indicate subjects with SCA who were in the premanifest stage (SARA ≤ 2.5). Each subject’s MRS score is a projection from 48-dimensional space (each regional metabolite contributes one dimension: DWDdimtot = dimVermis + dimCWM + dimPons = 18+16+14).

