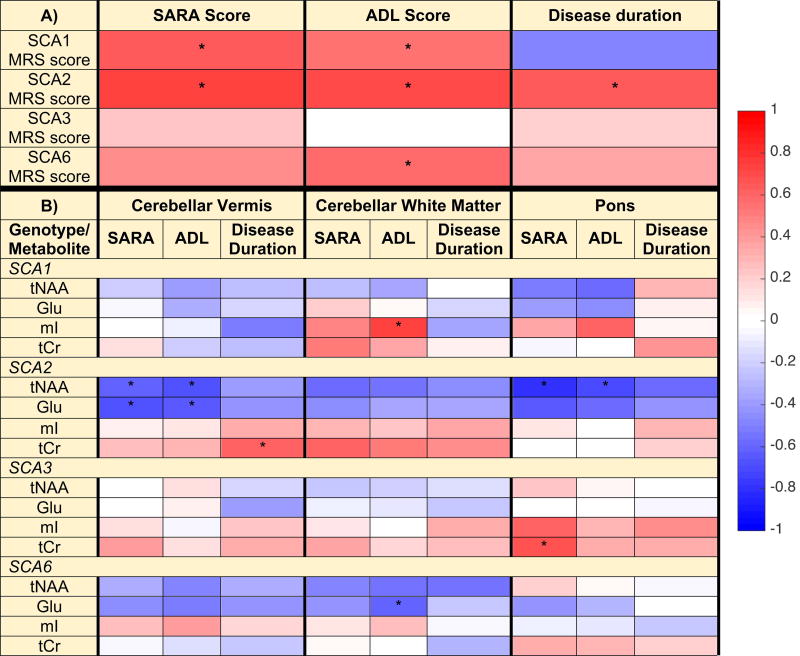
Fig. 7. Pearson correlations between DWD-based MRS scores and clinical measures (A) and between regional metabolite concentrations and clinical measures (B).
Correlations included subjects with SCA only, with MRS scores from DWD models of each SCA type vs. controls; the sign of the MRS scores were reversed so that larger positive scores correspond to being farther from the hyperplane (farther from controls). The heat map and corresponding color bar reflect the magnitude of the correlation coefficients. Correlations with p < 0.05 (type I error corrected) are denoted with ‘*’. Correlations, confidence intervals, and p-values are provided in Tables S2 and S3.

