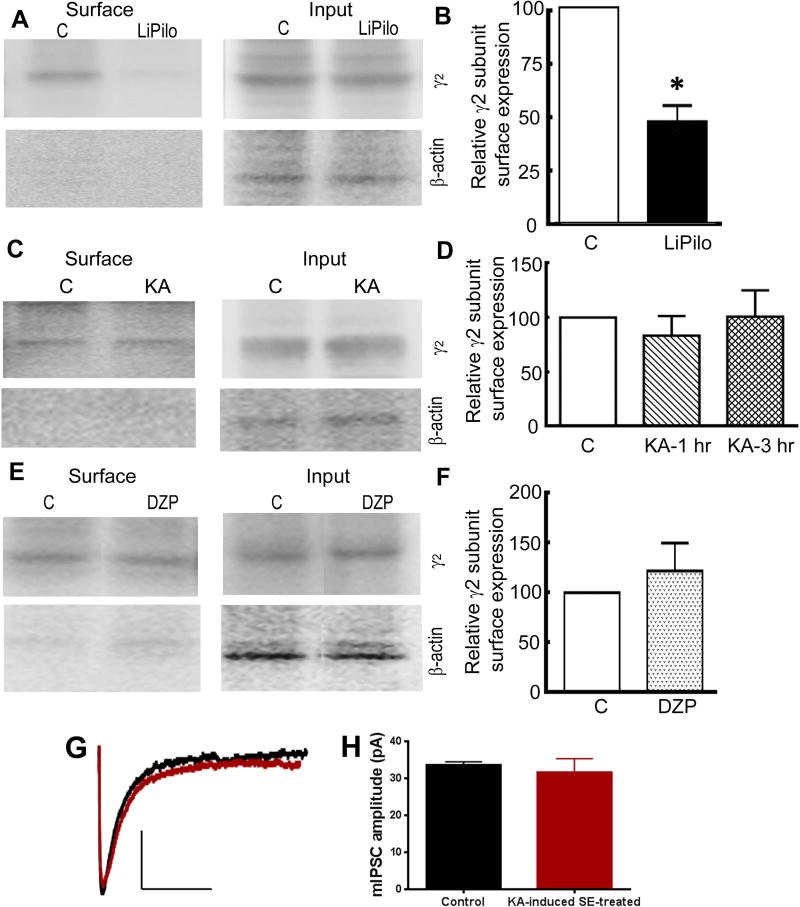
Figure 3. The hippocampal γ2 subunit surface expression was reduced during LiPilo-induced SE but not during KA-induced SE.
A, Sample Western blots of the surface protein fraction and the total protein fraction (input) of the GABAR γ2 subunit in hippocampal slices acutely obtained from P23 – 25 controls animals (C) and animals in status epilepticus of 1 hour in duration induced by a combination of lithium and pilocarpine (LiPilo). The purity of surface proteins was checked in each assay by confirming the absence of β-actin expression in the surface protein fraction. B, The surface expression of the γ2 subunit presented as mean ± SEM of the ratio of the surface-to-total expression in control slices and LiPilo-induced SE-treated slices acutely obtained one hour after seizure onset. n=6, * p < 0.05. C, Sample Western blots of the surface protein fraction and the total protein fraction of the GABAR γ2 subunit in hippocampal slices acutely obtained from P23 – 25 control animals (C) and animals in status epilepticus of 1 hour in duration induced by kainic acid (KA). The purity of surface proteins was checked in each assay by confirming the absence of β-actin expression in the surface protein fraction. D, The surface expression of the γ2 subunit presented as mean ± SEM of the ratio of the surface-to-total expression in control slices and KA-induced SE-treated slices obtained either 1 hour or 3 hours after seizure onset. n=5 at 1 hour post-KA-induced SE and n=6 at 3 hours post-KA-induced SE. E, Sample Western blots of the surface protein fraction and total protein fraction (input) of the GABAR γ2 subunit in hippocampal slices acutely obtained from P23 – 25 control animals (C) or lithium-pretreated animals that received diazepam (10 mg/kg) 10 minutes prior to the injection of pilocarpine (DZP). The slices were obtained 90 minutes after the administration of the pilocarpine. The purity of surface proteins was checked in each assay by confirming the absence of β-actin expression in the surface protein fraction. F, The surface expression of the γ2 subunit presented as mean ± SEM of the ratio of the surface-to-total expression in control slices and DZP slices, n=5. G, Averaged mIPSC traces from a control (black) DGC and a KA-induced SE-treated (red) DGC voltage clamped to a holding potential of −60 mV. The median amplitude for the mIPSCs recorded from the control neuron displayed here was 34 pA (black tracing) and that for the KA-induced SE-treated neurons displayed here was 31 pA (red tracing). H, A bar graph displaying the mean of the median mIPSC amplitude for the population of control and KA-induced SE-treated DGCs. N=8 neurons from 4 control animals and N=8 neurons from 5 SE animals.

