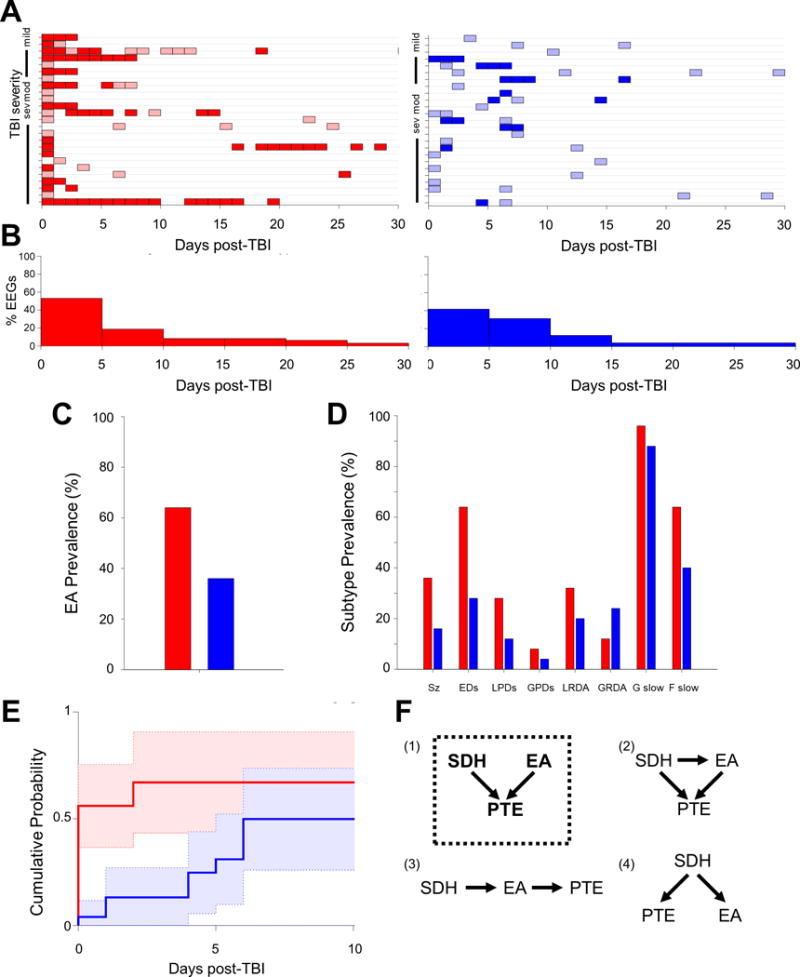
Figure 1.

EEG recording distribution and prevalence in PTE1 (red) and non-PTE1 (blue) patients. A) EEG recording days (colored boxes) plotted for individual patients plotted along y-axis based on TBI severity. Shading based upon presence (dark) or absence (light) of EA during that day’s recording. B) Histogram summarizing the proportion of EEGs during each 5 day time-period. C) Prevalence of EA in PTE1 and non-PTE1 groups. D) Prevalence of EA subtypes in PTE1 and non-PTE1 groups. E) Cumulative probability of the first appearance EDs in recordings up to the first 10 days post-TBI. F) Models of possible causal relationship between SDH, EA and PTE1. Model (1) with dotted box outline is the most likely model based upon logistic regression.
