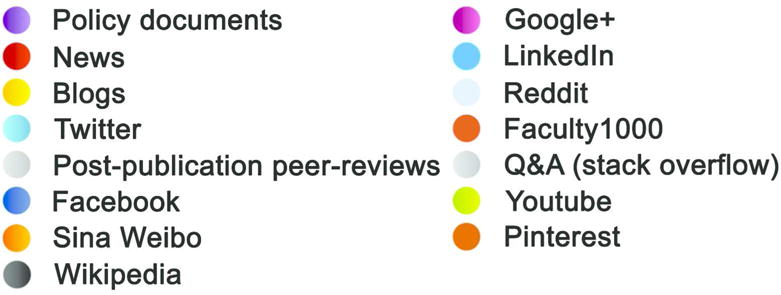
Figure 1.

Colors of the Altmetric Score each represent a different source. The amount of each color will change depending on which sources a research output has received attention from. Because the attention from many of the sources are real-time or daily feeds, the colors of the donut and the score may change daily. Figure reproduced from https://www.altmetric.com/about-our-data/the-donut-and-score/ and last accessed 12/05/2017.
