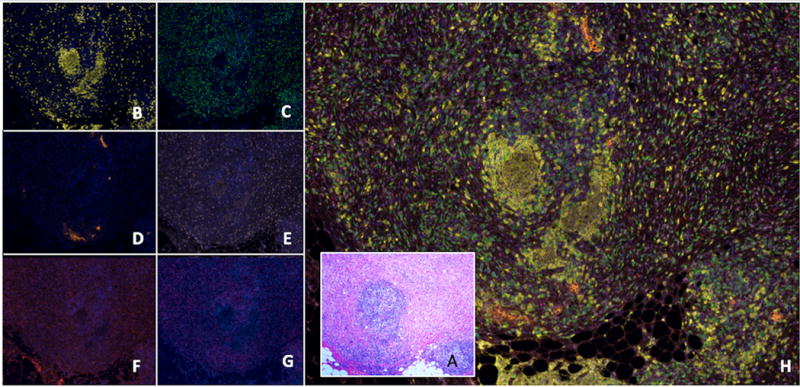
Figure 2.

A representative tertiary lymphoid structure (TLS) identified in desmoplastic melanoma (DM) seen by hematoxylin and eosin (H&E) and multispectral immunofluorescent staining. (A) A routine stained section of DM invading to the subcutaneous adipose tissue (A, H&E, 2X). An intratumoral lymphoid aggregate is evident near the center of the image, which is detailed in images B–H. Other peritumoral lymphoid aggregates are also evident at the tumor margin invading fat on the inferior aspect of the image. Spectrally unmixed images (20x) of the corresponding section are shown including: (B) A follicle of CD20+ B cells (yellow); (C) CD8+ T cells (green) surrounding the B cell center; (D) PNAd+ vasculature (orange) adjacent to the B-cell zones; (E) Ki67 (light pink) marker highlighting proliferating lymphoid cells but also tumor cells; (F) CD83+ activated dendritic cells (red) predominantly in the T cell zone; (G) FoxP3 (magenta) staining scattered cells. (H) A composite image highlighting all the markers studied composing a well-formed TLS.
