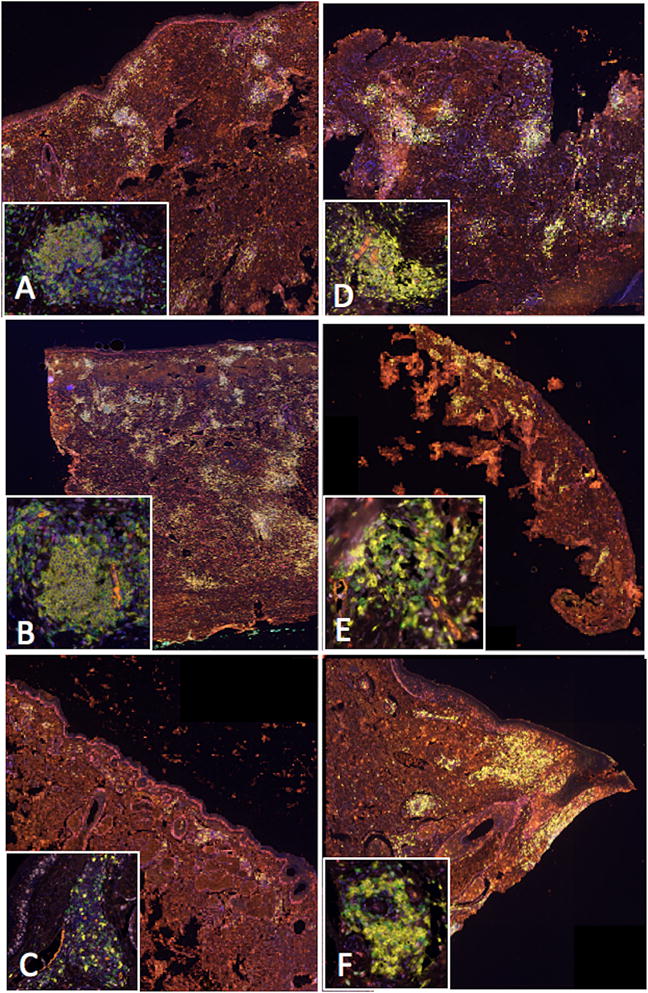
Figure 3.

Multispectral immunofluorescent, spectrally unmixed, composite images of classical TLS identified in DM cases (10x). Brightly staining areas are TLS visualized at low-power throughout the dermis. Inset images display a high-power view of a single TLS (20x). Key: CD20+ (B cells) = yellow; CD8+ (T cells) = green; PNAd+ (HEVs) = orange; CD83+ (activated dendritic cells) = red; Ki67+ (proliferation marker) = light pink; FoxP3+ (T regs) = magenta; DAPI (nuclear counterstain) = blue. In all these images, the biopsies are comprised almost completely of the desmoplastic melanoma, and all the TLS in the insets are within the tumors, rather than at invasive margins.
