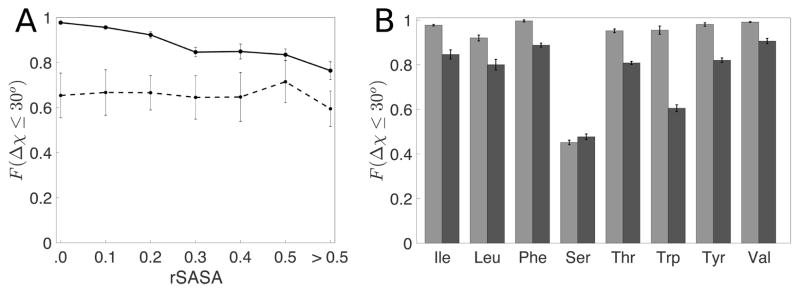
Figure 7.
A) Fraction of residues predicted within 30° (F(Δχ ≤ 30°)) for Ile residues in the Dun1.0 database (solid line) and their corresponding dipeptide mimetics (dotted line) as a function of rSASA values. The dotted line provides lower bounds for the prediction accuracy for the residues in each rSASA bin. Due to the low frequency of uncharged residues in the non-core region, we have combined all residues with rSASA > 0.5 into one bin. B) F(Δχ ≤ 30°) for non-charged amino acids for rSASA < 10−3 (light grey) and 0.2 < rSASA ≤ 0.3 (dark grey).

