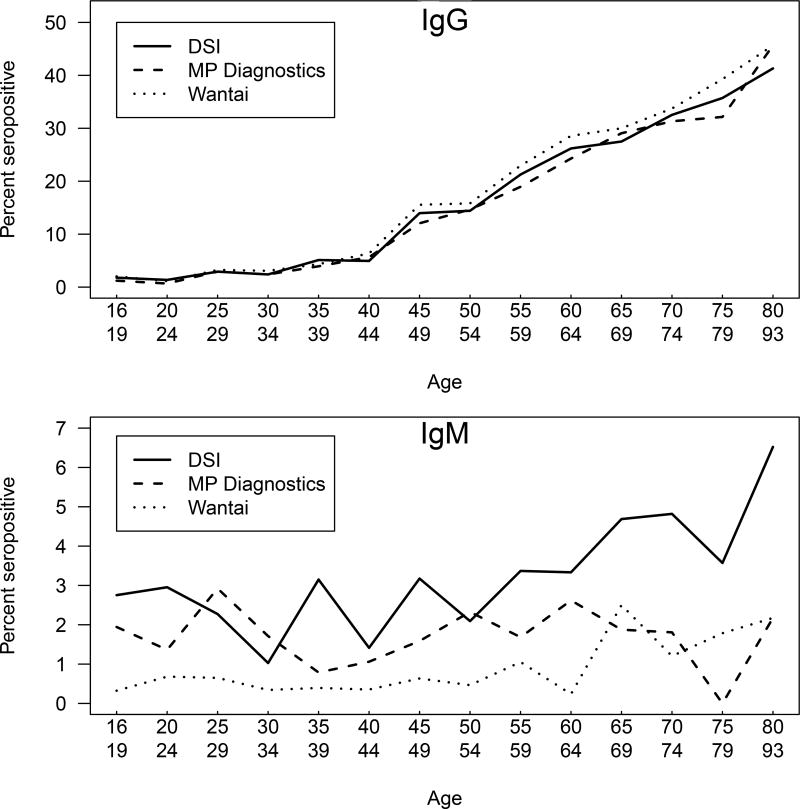
Figure 2.
Seroprevalence by age. Upper panel, anti-HEV IgG/total antibodies; lower panel, anti-HEV IgM. Solid line, DSI; dashed line MP Biomedicals; dotted line, Wantai. Data were plotted by averaging the seroprevalence by age range from donors 15 to 80 years of age in increments of 5 years, and all ages above 80 years of age formed the last range. Seroprevalence within each age range was plotted versus the mean age within the age range.

