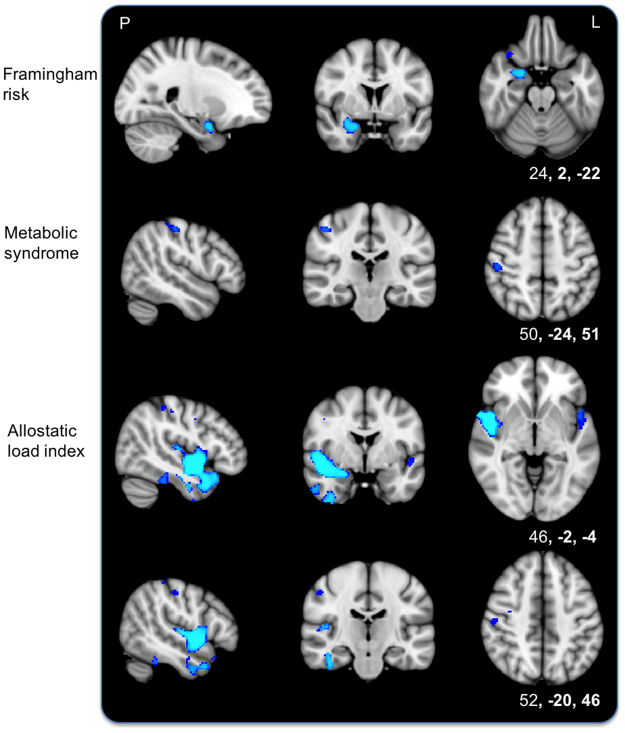
Figure 1.
Simple linear t-tests of each marker and lower voxelwise grey matter density. T-tests show an association of higher Framingham stroke risk (top), metabolic syndrome (middle) and allostatic load index (bottom two rows) with lower voxelwise grey matter after removing the effects of socio-demographic variables. Blue represents regions significant at p < 0.05, threshold-free cluster enhancement, corrected for multiple comparisons. P, posterior; L, left. Coordinates are in MNI space.

