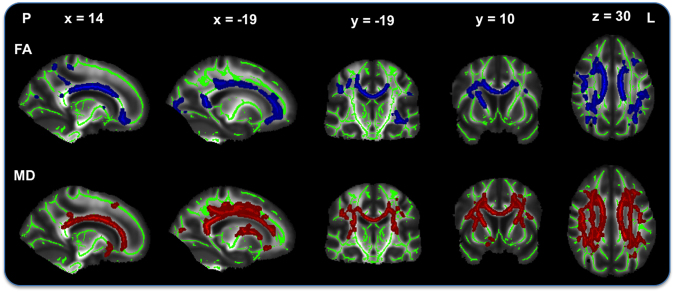
Figure 3.
Simple linear t-test of Framingham stroke risk and lower white matter integrity. T-tests show an association of higher Framingham stroke risk with lower fractional anisotropy (FA; top) and higher mean diffusivity (MD; bottom) after removing the effects of socio-demographic variables. Results represent voxels significant at p < 0.05, threshold-free cluster enhancement, multiple comparisons corrected. Significant regions are dilated for illustrative purposes, overlaid on a green skeleton. P, posterior; L, left. Coordinates are in MNI space.

