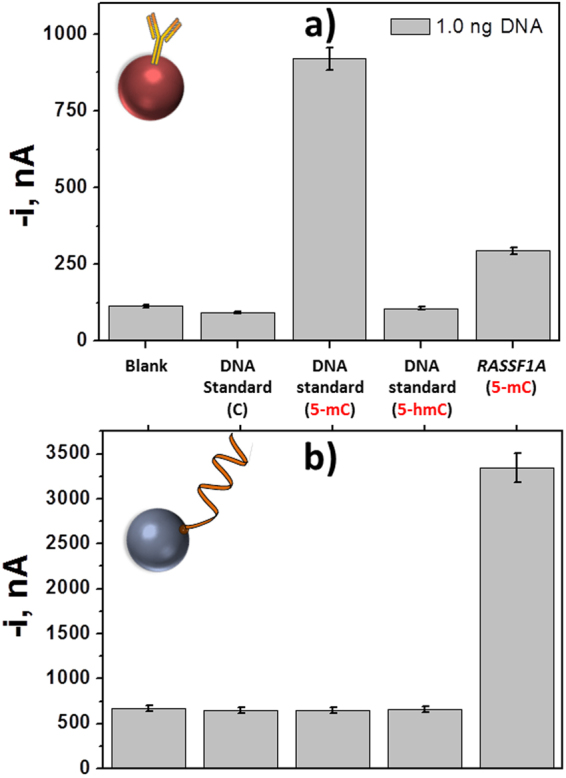
Figure 4.

Selectivity of biosensors. Comparison of the amperometric responses obtained with the inmunosensor (a) and the DNA sensor for RASSF1A promoter region (b) in the absence of DNA (blank) and in the presence of 1 ng of unmethylated and methylated with 5-mC and 5-hmC DNA standards and the synthetic methylated target DNA sequence of the RASSF1A and MGMT promoters region. Error bars estimated as triple of the standard deviation of three replicates.
