
Fig. 7.
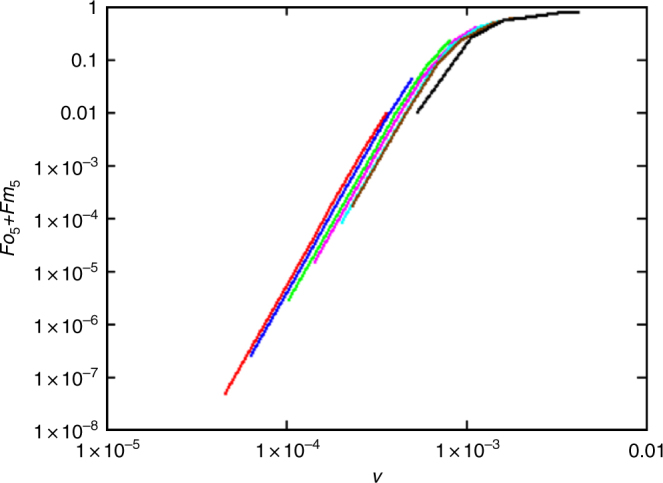
Penetration of mutants with five selected mutations. Penetration after 900 generations as a function of mutator mutation rate v for values of u between 5 × 10⁻⁷ (black curve on the right) and 4 × 10⁻⁶ (red curve on the left)
Official websites use .gov
A
.gov website belongs to an official
government organization in the United States.
Secure .gov websites use HTTPS
A lock (
) or https:// means you've safely
connected to the .gov website. Share sensitive
information only on official, secure websites.
Penetration of mutants with five selected mutations. Penetration after 900 generations as a function of mutator mutation rate v for values of u between 5 × 10⁻⁷ (black curve on the right) and 4 × 10⁻⁶ (red curve on the left)