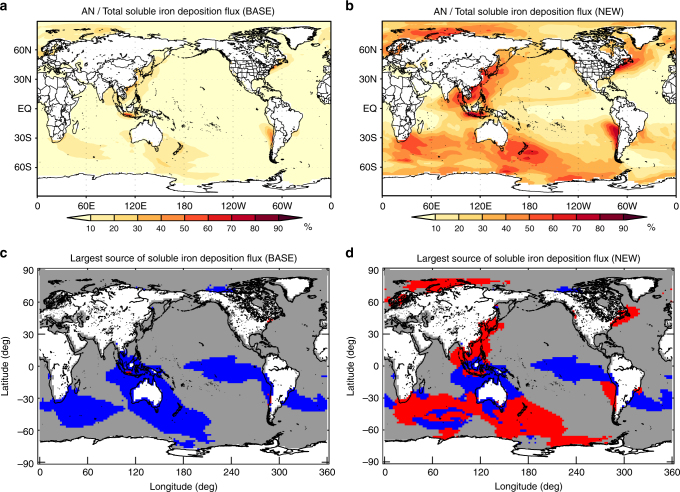
Fig. 4.
Source contributions of soluble iron deposition flux. a, b Global distributions of the contribution of anthropogenic (AN) sources to total soluble iron deposition flux (AN+BB+Dust) for a the BASE and b the NEW simulations (5-year mean). c, d Global distributions of the largest source of soluble iron deposition flux for c the BASE and d the NEW simulations. AN-, BB-, and Dust-dominant regions are shown by red, blue, and gray, respectively. Figures were made using IGOR Pro, WaveMetrics Inc., Oswego, OR

