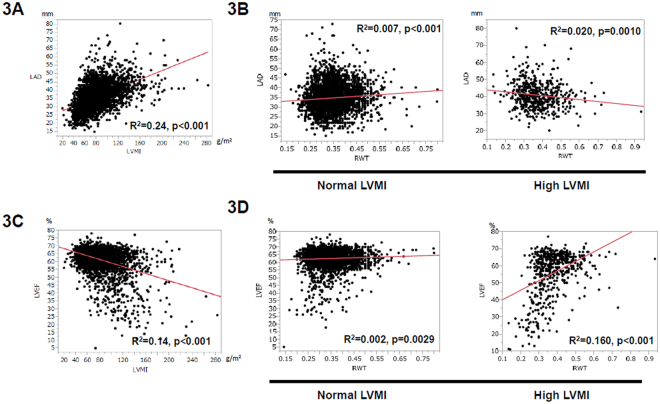
Figure 3.
Association with LVMI, RWT, LA diameter, and LVEF. (A) Association between LVMI and LA diameter (LAD). Scatter plots show the positive correlation between LVMI and LAD. R2 = 0.24, p < 0.001. R = correlation coefficient. (B) Association between RWT and LAD. In patients with normal LVMI (left panel), scattered plots showed small correlation between RWT and LA diameter. R2 = 0.007, p < 0.001. In high LVMI (right panel), scatter plots showed small but, negative correlation between RWT and LA diameter. R2 = 0.020, p = 0.0010. (C) Association between LVMI and LVEF. Scatter plots showed the negative correlation between LVMI and LVEF. R2 = 0.14, p < 0.001. (D) Association between RWT and LVEF. In normal LVMI (left panel), scatter plots showed small correlation between RWT and LVEF. R2 = 0.002, p = 0.0029. In high LVMI (right panel), scatter plots showed small but, positive correlation between RWT and LVEF. R2 = 0.160, p < 0.001.

