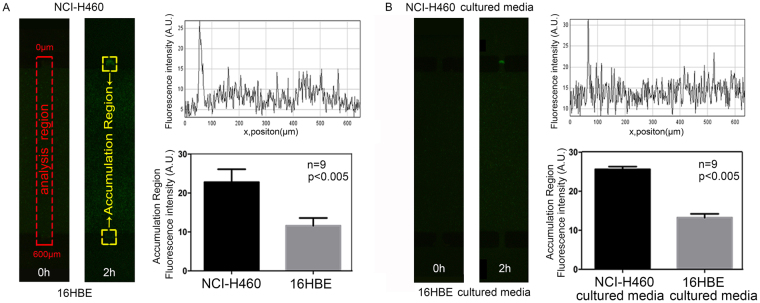
Figure 4.
Analysis of quantitative bacterial chemotaxis. Bacterial chemotaxis was quantified by comparing the fluorescence intensity in the analysis region marked with red rectangle. Preferential accumulation of bacteria was compared by the fluorescence intensities in the two yellow marked rectangles of accumulation regions. (A) E. coli chemotaxis was firstly examined against NCI-H460 and 16HBE. The independent culture chambers were cultivated with cells, and the central channel was inoculated with bacteria. Significantly, higher preferential taxis of bacteria were illustrated towards cancerous cells as shown by the fluorescence images (left), and plots of intensities and average areal intensities of fluorescence (right). (B) The bacterial taxis towards cancerous cells, reasoned of biochemical molecules released by the cells, were examined by the preference of bacteria towards the medium used for cell cultures. The n = 9 represents 9 biological replicates, the error bars represent the standard deviation of means, and a difference of P < 0.05 was considered statistically significant.

