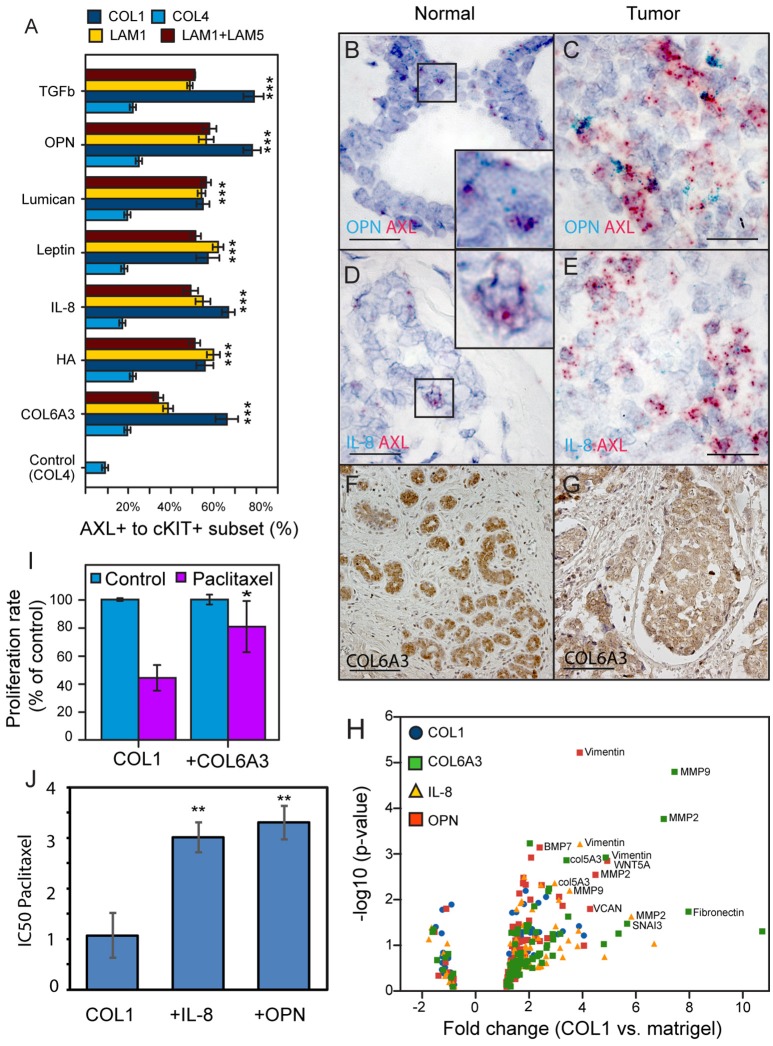
Figure 4.
Identification and in vivo validation of microenvironment factors that impose AXL and cKIT expression phenotypes in malignant breast cancer cells. (A) AXL+/cKIT+-184AA3 phenotype expression in MEMA experiments was analyzed by GLM, and the most significant (Tuckey's post-hoc test, p < 2e-16***) microenvironment supplemental factors combined with different ECM are presented in bar graph format. (B,C) Co-expression of OPN (cyan), and AXL (red) were determined by RNA in situ hybridization of normal human mammary gland tissue (B), and TNBC (C) specimens. Co-expression IL-8 (cyan), and AXL (red) in normal human mammary gland tissue (D), and TNBC (E) specimens. Scale bar represent 20 μm (B–E). Expression of COL6A3 in normal human mammary gland tissue (F), and TNBC (G) specimens were assayed by IHC-P. (F,G) Scale bar = 100 μm. Counterstaining by hematoxylin (B–G). (H) Volcano plot represent EMT related gene expression (RT2Profiler™ PCR array, Human Epithelial to mesenchymal transition EMT, Qiagen) in 184AA3 cell cultured (24 h) on COL1, with or without OPN, IL-8, or COL6A3 was compared to expression profile of 184AA3 cells on matrigel. Results represent mean of three individual experiments, and p-values are calculated by comparing each gene expression in each group with the matrigel group, ***≤0.001. (I) To study drug resistance, 184AA3 cells were cultured on COL1 coated dishes supplemented with or without COL6A3, and treated with 0.1 μM paclitaxel. Data represent EdU positive cells as a percentage of total cells compared to COL1 control culture. Results represent mean ± SD in 6 individual experiments, significance between COL1 and COL1+COL6A3, *p = 0.02. (J) To study impact of OPN and IL-8 on paclitaxel IC50 values (μg/ml), 184AA3 cells were cultured on COL1 with or without OPN or IL-8. Cells were treated with Paclitaxel (ranging from 0.001 to 1 μg/ml). Results represent mean ± SD in 3 individual experiments, significance between IC50 values, **p < 0.01.

