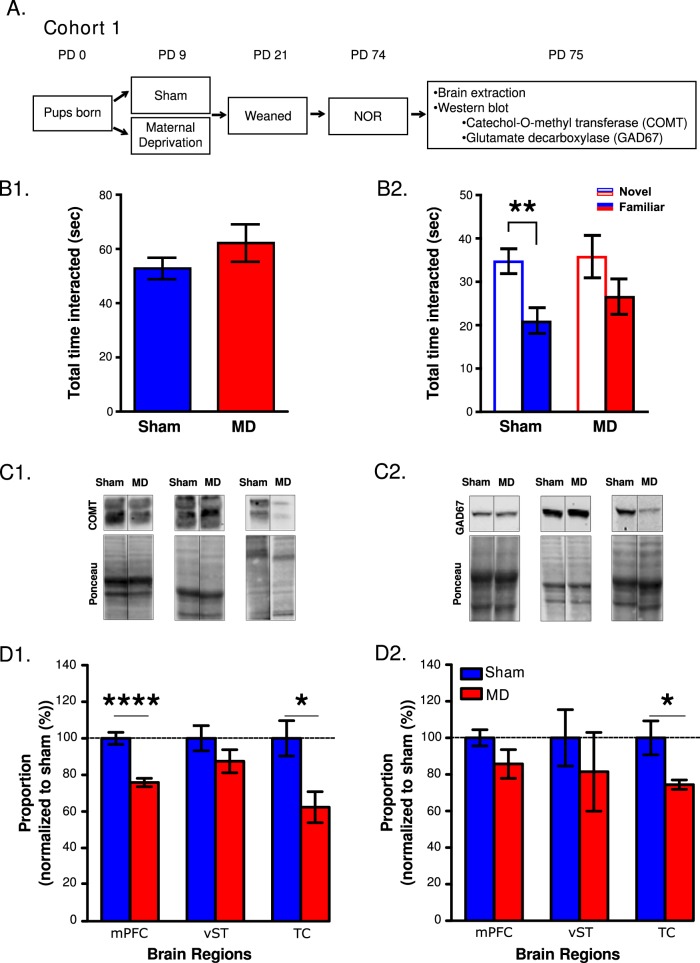
Fig. 1. Experimental timeline, novel object recognition (NOR), and protein expression following MD or sham.
a A timeline of experiments from cohort 1. b1 Total time interacted (s) with both objects collectively and b2 with the novel or familiar object, separately (Bonferroni corrected planned comparison, **p < 0.01; significantly different than familiar object). c1 Examples of Catechol-o-methyl transferase (COMT) and c2 glutamic acid decarboxylase (GAD67) western blot, and associated Ponceau stain from the medial prefrontal cortex (mPFC), ventral striatum (vST), and temporal cortex (TC) from a sham and MD animal. d1 COMT and d2 GAD67 protein expression (bar graphs) from the mPFC, vST, and TC between groups. Protein expression is normalized to shams (dashed line). (Unpaired two-tailed t-tests, *p < 0.05, ****p < 0.0001; significantly different than shams). All data are depicted as mean ± SEM

