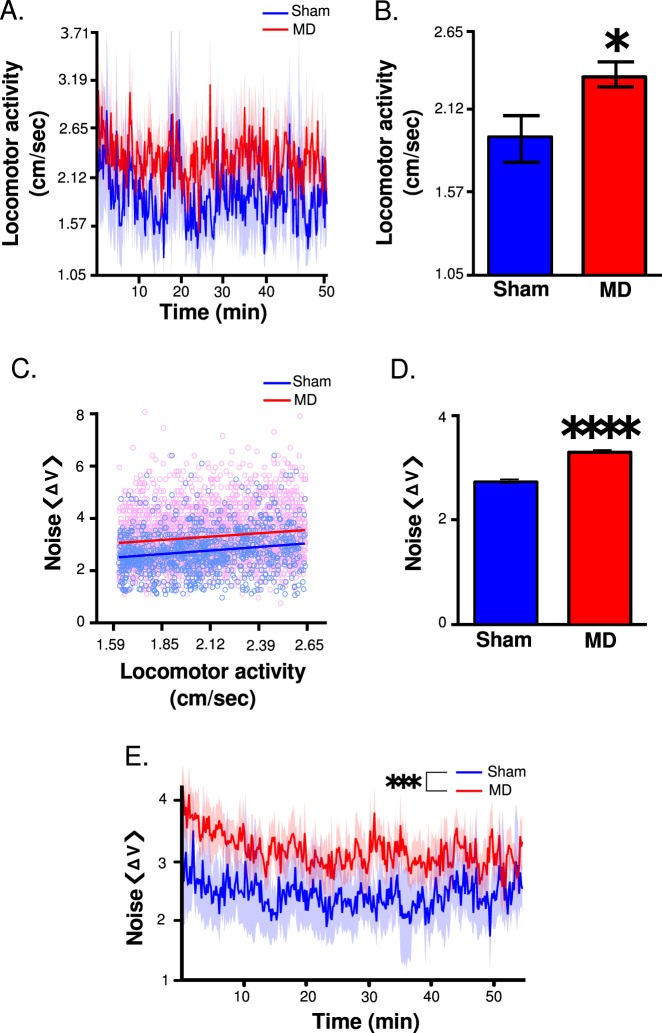
Fig. 3. Locomotor activity and differences in bioelectric noise following MD or sham.
a Mean locomotor activity (solid line) during electrophysiological recordings ± SEM (shaded portion), b with significantly increased activity in the MD group (Unpaired two-tailed t-test, *p < 0.05; significantly different than sham). c Correlation between from the TC and locomotor activity when locomotor activity was held constant in MD and sham groups. d An increase in is observed when locomotor speed is held constant. (Unpaired two-tailed t-test, ****p < 0.0001, significantly different than sham group). All data are depicted as mean ± SEM. e Bioelectric noise (solid line) ± standard deviation (SD) (shaded portion) in the TC throughout the recording session

