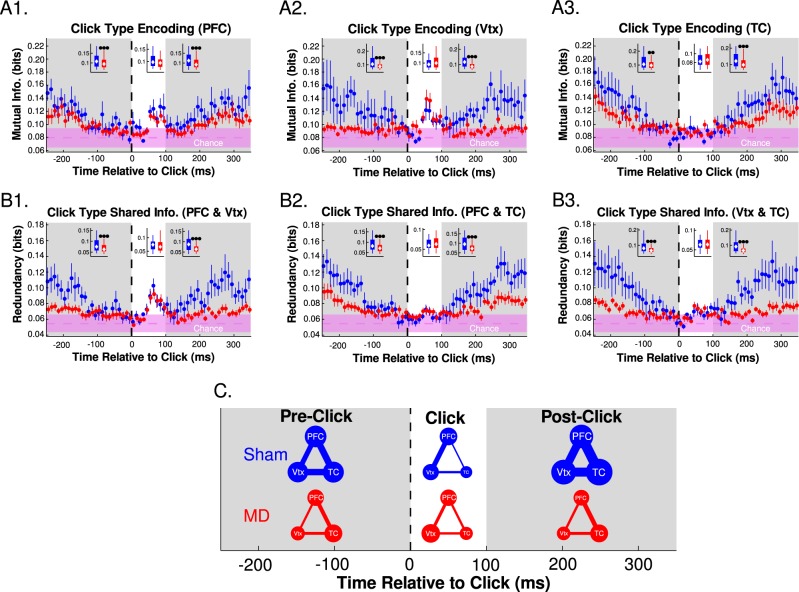
Fig. 5. Click type encoding is less stable in MD animals.
a Click type (1st or 2nd) encoding measured by mutual information between electrode voltage and click type (bin size: 10 ms, dots: mean, error bars: SEM, chance region: median and Standard Deviation (fringe) of null model data). Inset (data collapsed in time regions): gray background (pre-click and post-click); white background (during click), (box plots (5th percentile, interquartile range, median, 95th percentile) Mann–Whitney, *p < 0.05, **p < 0.01, ***p < 0.001). b Shared click type encoding between pairs of brain regions as measured by redundancy (inset and chance region: identical structure to (a)). c Large dots represent more information and thicker lines represent more shared information. Dot radius and line width linearly scaled to median values in (a) and (b) insets

