Figure 5.
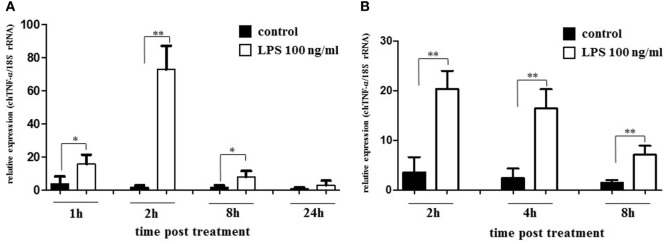
Relative expression of chicken TNF-α (chTNF-α) mRNA in lipopolysaccharide (LPS) stimulated monocyte derived and splenic macrophages. Macrophages isolated either from blood monocytes (A) or spleen tissue (B) by plastic adherence were stimulated with LPS (100 ng/ml) for the indicated periods. Control macrophages remained unstimulated. Relative expression levels of chTNF-α were analyzed by qRT-PCR. Data represent three independent experiments, significant differences between controls and stimulated cells are indicated (*p ≤ 0.05; **p < 0.01; Student’s t-test).

